
Investor Day Presentation November 2021 Who: People with Passion and Purpose What: Dedicated to Transforming Healthcare for Patients, Providers, and Payors How: Patient-Centric, Physician-Led, and Population Health Management Focused
UNITED STATES
SECURITIES AND EXCHANGE COMMISSION
Washington, D.C. 20549
SCHEDULE 14A
Proxy Statement Pursuant to Section 14(a) of the
Securities Exchange Act of 1934
Filed by the Registrant ☒ Filed by a Party other than the Registrant ☐
Check the appropriate box:
| ☐ | Preliminary Proxy Statement | |
| ☐ | Confidential, for Use of the Commission Only (as permitted by Rule 14a-6(e)(2)) | |
| ☐ | Definitive Proxy Statement | |
| ☒ | Definitive Additional Materials | |
| ☐ | Soliciting Material under §240.14a-12 | |
Foresight Acquisition Corp.
(Name of Registrant as Specified In Its Charter)
N/A
(Name of Person(s) Filing Proxy Statement, if other than the Registrant)
Payment of Filing Fee (Check the appropriate box):
| ☒ | No fee required. | |||
| ☐ | Fee computed on table below per Exchange Act Rules 14a-6(i)(1) and 0-11. | |||
| (1) | Title of each class of securities to which transaction applies:
| |||
| (2) | Aggregate number of securities to which transaction applies:
| |||
| (3) | Per unit price or other underlying value of transaction computed pursuant to Exchange Act Rule 0-11 (set forth the amount on which the filing fee is calculated and state how it was determined):
| |||
| (4) | Proposed maximum aggregate value of transaction:
| |||
| (5) | Total fee paid:
| |||
| ☐ | Fee paid previously with preliminary materials. | |||
| ☐ | Check box if any part of the fee is offset as provided by Exchange Act Rule 0-11(a)(2) and identify the filing for which the offsetting fee was paid previously. Identify the previous filing by registration statement number, or the Form or Schedule and the date of its filing. | |||
| (1) | Amount Previously Paid:
| |||
| (2) | Form, Schedule or Registration Statement No.:
| |||
| (3) | Filing Party:
| |||
| (4) | Date Filed:
| |||
Investor Day Presentation November 2021 Who: People with Passion and Purpose What: Dedicated to Transforming Healthcare for Patients, Providers, and Payors How: Patient-Centric, Physician-Led, and Population Health Management Focused
Disclaimer BASIS OF PRESENTATION This presentation is provided for informational purposes only and has been prepared to assist interested parties in making their own evaluation with respect to a potential business combination (the “proposed business combination”) between P3 Health Partners (“P3”) and Foresight Acquisition Corp. (“Foresight” or “SPAC”), and related transactions, and for no other purpose. No representations or warranties, express or implied are given in, or in respect of, this presentation. To the fullest extent permitted by law, in no circumstances will P3, Foresight or any of their respective subsidiaries, stockholders, affiliates, representatives, partners, directors, officers, employees, advisers or agents be responsible or liable for any direct, indirect or consequential loss or loss of profit arising from the use of this presentation, its contents, its omissions, reliance on the information contained within it, or on opinions communicated in relation thereto or otherwise arising in connection therewith. Industry and market data used in this presentation have been obtained from third party industry publications and sources. None of P3 or Foresight has independently verified the data obtained from these sources and cannot assure you of the data’s accuracy or completeness. This data is subject to change. In addition, this presentation does not purport to be all-inclusive or to contain all of the information that may be required to make a full analysis of P3 or the proposed business combination. Recipients of this presentation should each make their own evaluation of P3 and of the relevance and adequacy of the information and should make such other investigations as they deem necessary. FORWARD-LOOKING STATEMENTS Any investment in or purchase of any securities of P3 or Foresight is speculative and involves a high degree of risk and uncertainty. This presentation includes “forward-looking statements” within the meaning of the “safe harbor” provisions of the United States Private Securities Litigation Reform Act of 1995. Forward-looking statements may be identified by the use of words such as “estimate,” “plan,” “project,” “forecast,” “intend,” “will,” “expect,” “anticipate,” “believe,” “seek,” “target” or other similar expressions that predict or indicate future events or trends or that are not statements of historical matters. These forward-looking statements include, but are not limited to, statements regarding estimates and forecasts of financial and performance metrics, projections of market opportunity and market share, expectations and timing related to site build-outs and capacity deployment, potential benefits of the transaction and the potential success of P3’s strategy and expectations related to the terms and timing of the proposed business combination and related transactions. These statements are based on various assumptions, whether or not identified in this presentation, and on the current expectations of P3’s and Foresight’s management and are not predictions of the actual performance. These forward-looking statements are provided for illustrative purposes only and are not intended to serve as, and must not be relied on by any investor as, a guarantee, an assurance, a prediction or a definitive statement of fact or probability. Actual events and circumstances are difficult or impossible to predict and will differ from assumptions. Many actual events and circumstances are beyond the control of P3 and Foresight. These forward-looking statements are subject to a number of risks and uncertainties, including changes in domestic and foreign business, market, financial, political, legal and regulatory conditions; the inability of the parties to successfully or timely consummate the proposed business combination, including the risk that the conditions to the proposed business combination are not satisfied or waived, including that any required regulatory approvals are not obtained, are delayed or are subject to unanticipated conditions that could adversely affect the combined company or the expected benefits of the proposed business combination or that the approval of the stockholders of Foresight is not obtained; failure to realize the anticipated benefits of the proposed business combination; risks related to the effects and uncertainties created by the ongoing COVID-19 pandemic; risks relating to the uncertainty of the projected financial information with respect to P3; risks related to the rollout of P3’s business and the timing of expected business milestones; risks related to P3’s commercial partnerships, including the inability of P3 and commercial counterparties to enter into definitive agreements; future global, regional or local economic and market conditions; the development, effects and enforcement of laws and regulations; P3’s ability to manage future growth; P3’s ability to develop new products and solutions, bring them to market in a timely manner, and make enhancements to its platform; the effects of competition on P3’s future business; the amount of redemption requests made by Foresight’s public stockholders; the ability of Foresight or the combined company to issue equity or equity-linked securities in connection with the proposed business combination or in the future; the outcome of any potential litigation, government and regulatory proceedings, investigations and inquiries; and those factors discussed in Foresight’s Annual Report on Form 10-K for the year ended December 31, 2020 and filed with the SEC on April 6, 2021 (the “Annual Report”) under the heading “Risk Factors,” Definitive Proxy Statement on Schedule 14A filed with the SEC on October 28, 2021 under the heading “Risk Factors,” and other documents of Foresight filed, or to be filed, with the SEC. If any of these risks materialize or our assumptions prove incorrect, actual results could differ materially from the results implied by these forward-looking statements. There may be additional risks that neither Foresight nor P3 presently know or that Foresight and P3 currently believe are immaterial that could also cause actual results to differ from those contained in the forward-looking statements. In addition, forward-looking statements reflect Foresight’s and P3’s expectations, plans or forecasts of future events and views as of the date of this presentation. Foresight and P3 anticipate that subsequent events and developments will cause Foresight’s and P3’s assessments to change. However, while Foresight and P3 may elect to update these forward-looking statements at some point in the future, Foresight and P3 specifically disclaim any obligation to do so. These forward-looking statements should not be relied upon as representing Foresight’s and P3’s assessments as of any date subsequent to the date of this presentation. Accordingly, undue reliance should not be placed upon the forward-looking statements. 1
Disclaimer USE OF PROJECTIONS AND DESCRIPTION OF KEY CONTRACTS AND PARTNERSHIPS This presentation contains projected financial information with respect to P3, namely revenue and EBITDA for 2021. Such projected financial information constitutes forward-looking information, and is for illustrative purposes only and should not be relied upon as necessarily being indicative of future results. The assumptions and estimates underlying such projected financial information are inherently uncertain and are subject to a wide variety of significant business, economic, competitive and other risks and uncertainties that could cause actual results to differ materially from those contained in the prospective financial information. See “Forward-Looking Statements” above. Actual results may differ materially from the results contemplated by the projected financial information contained in this presentation, and the inclusion of such information in this presentation should not be regarded as a representation by any person that the results reflected in such projections will be achieved. Neither the independent auditors of Foresight nor the independent auditors of P3, audited, reviewed, compiled, or performed any procedures with respect to the projections for the purpose of their inclusion in this presentation, and accordingly, neither of them expressed an opinion or provided any other form of assurance with respect thereto for the purpose of this presentation. This presentation contains descriptions of certain key business partnerships of P3. These descriptions are based on the P3 management team’s discussions with such counterparties and the latest available information and estimates as of the date of this presentation. In each case, such descriptions are subject to negotiation and execution of definitive agreements with such counterparties which have not been completed as of the date of this presentation and, as a result, such descriptions of key business partnerships of P3, remain subject to change FINANCIAL INFORMATION; NON-GAAP FINANCIAL MEASURES The financial information and data contained in this presentation is unaudited and does not conform to Regulation S-X. Accordingly, such information and data may not be included in, may be adjusted in or may be presented differently in, any proxy statement, registration statement, or prospectus to be filed by Foresight with the SEC. Some of the financial information and data contained in this presentation, such as EBITDA and EBITDA Margin have not been prepared in accordance with United States generally accepted accounting principles (“GAAP”). EBITDA is defined as net earnings (loss) before interest expense, income tax expense (benefit), depreciation and amortization. Foresight and P3 believe these non-GAAP measures of financial results provide useful information to management and investors regarding certain financial and business trends relating to P3’s financial condition and results of operations. Foresight and P3 believe that the use of these non-GAAP financial measures provides an additional tool for investors to use in evaluating projected operating results and trends in and in comparing P3’s financial measures with other similar companies, many of which present similar non-GAAP financial measures to investors. Management does not consider these non-GAAP measures in isolation or as an alternative to financial measures determined in accordance with GAAP. The principal limitation of these non-GAAP financial measures is that they exclude significant expenses and income that are required by GAAP to be recorded in P3’s financial statements. In addition, they are subject to inherent limitations as they reflect the exercise of judgments by management about which expense and income are excluded or included in determining these non-GAAP financial measures. P3 is not providing a reconciliation of its projected EBITDA, EBITDA Margin and other metrics for full years 2021-2025 to the most directly comparable measure prepared in accordance with GAAP because P3 is unable to provide this reconciliation without unreasonable effort due to the uncertainty and inherent difficulty of predicting the occurrence, the financial impact, and the periods in which the adjustments may be recognized. For the same reasons, P3 is unable to address the probable significance of the unavailable information, which could be material to future results. ADDITIONAL INFORMATION ABOUT THE PROPOSED BUSINESS COMBINATION AND WHERE TO FIND IT The proposed business combination will be submitted to stockholders of Foresight for their consideration. Foresight filed a definitive proxy statement (the “Proxy Statement”) with the SEC on October 28, 2021 and Foresight mailed the definitive Proxy Statement and other relevant documents to its stockholders as of the record date established for voting on the proposed business combination. Foresight’s stockholders and other interested persons are advised to read the definitive Proxy Statement and any amendments thereto in connection with Foresight’s solicitation of proxies for its special meeting of stockholders to be held to approve, among other things, the proposed business combination, because these documents will contain important information about Foresight, P3 and the proposed business combination. Investors and securities holders may also obtain a copy of the definitive Proxy Statement as well as other documents filed with the SEC regarding the proposed business combination and other documents filed with the SEC by Foresight, without charge, at the SEC’s website located at www.sec.gov or by directing a request to Gateway Investor Relations, (949) 574-3860, FORE@gatewayir.com. INVESTMENT IN ANY SECURITIES DESCRIBED HEREIN HAS NOT BEEN APPROVED OR DISAPPROVED BY THE SEC OR ANY OTHER REGULATORY AUTHORITY NOR HAS ANY AUTHORITY PASSED UPON OR ENDORSED THE MERITS OF THE OFFERING OR THE ACCURACY OR ADEQUACY OF THE INFORMATION CONTAINED HEREIN ANY REPRESENTATION TO THE CONTRARY IS A CRIMINAL OFFENSE. 2
Disclaimer PARTICIPANTS IN THE SOLICITATION Foresight, P3 and certain of their respective directors, executive officers and other members of management and employees may, under SEC rules, be deemed to be participants in the solicitations of proxies from Foresight’s stockholders in connection with the proposed business combination. Information regarding the persons who may, under SEC rules, be deemed participants in the solicitation of Foresight’s stockholders in connection with the proposed business combination is set forth in the Proxy Statement filed with the SEC. You can find more information about Foresight’s directors and executive officers in the Proxy Statement and in Foresight’s Annual Report. Additional information regarding the participants in the proxy solicitation and a description of their direct and indirect interests is included in the Proxy Statement. Stockholders, potential investors and other interested persons should read the Proxy Statement carefully before making any voting or investment decisions. You may obtain free copies of these documents from the sources indicated above. NO OFFER OR SOLICITATION This presentation does not constitute an offer to sell or the solicitation of an offer to buy any securities, or a solicitation of any vote or approval, nor shall there be any sale of securities in any jurisdiction in which such offer, solicitation or sale would be unlawful prior to registration or qualification under the securities laws of any such jurisdiction. TRADEMARKS This presentation contains trademarks, service marks, trade names and copyrights of P3, Foresight and other companies, which are the property of their respective owners. 3

Foresight Acquisition Corp. Adds Significant Value to P3 Health Partners – Currently serves as President and Founder of his family office, – Former Partner and Co-Manager of the William Blair Wasson Enterprise Small Institutional portfolio and Small Cap Growth – Former CEO and President of Walgreens from 2009 to 2014. Fund Served Walgreens for 34 years, creating significant financial and – Over 30 years of experience working with public companies in shareholder value by initiating transformative mergers and the small cap space investments, leading organizational change, assembling diverse – Currently the Chairman of the Board of Performance leadership and establishing the company’s position as an Health Systems industry leader – Former Partner at Magnetar Capital, LLC, a multi-strategy – Invested and nurtured a portfolio of investments by adding value hedge fund through his ability to catalyze relationships for businesses, channel partners, key hires, and strategic investors to build – Co-founded Cityview Associates, a real estate investment firm sustainable, high-growth businesses that do well by doing good Greg Wasson – Recognized throughout the drugstore and healthcare industry for Michael Balkin Chairman of the Board transformational leadership, innovation, bold business decisions, Chief Executive Officer and Director and executing on strategic long-term visions –Lifelong leader in the healthcare space and known for his ability – A pharmacy, health and wellness expert who has led to transform companies and achieve financial and operational transformational change and cost-saving programs in highly success competitive consumer-focused businesses – Transformed a small pharmacy benefit management company –Previously served as an Operating Partner, Advisor and (PBM) called SXC Health Solutions into one of America’s biggest Consultant for Sycamore Partners, specializing in retail and and fastest growing players – then facilitated its $12.8 billion sale consumer investments to Optum – Former President and COO of Rite Aid Pharmacy – Former CEO of OptumRx from 2015 to 2017 – Former CEO and Chairman of Catamaran from 2006 to 2015 Mark Thierer Kermit Crawford Advisor Advisor 4 Deep experience in both private and public markets across Long-term focus on sustainable growth and development Aligned interest across SPAC, Wasson Enterprise and the entirety of the capital structure with the ability to add value investors
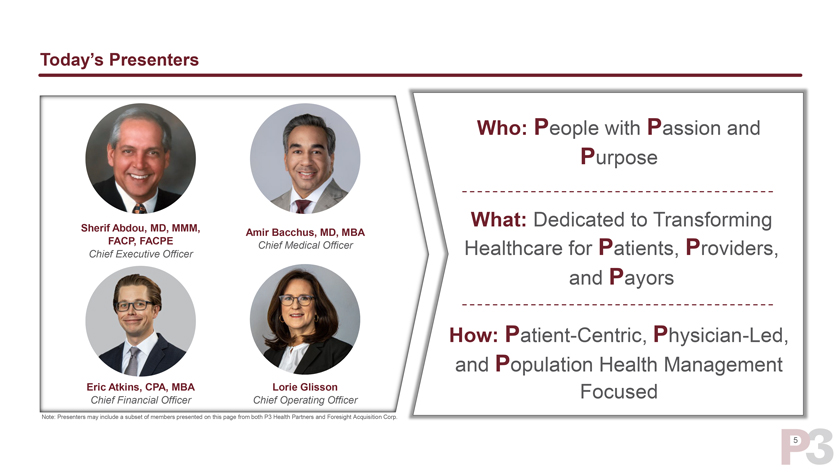
Today’s Presenters Who: People with Passion and Purpose What: Dedicated to Transforming Sherif Abdou, MD, MMM, Amir Bacchus, MD, MBA FACP, FACPE Chief Medical Officer Healthcare for Patients, Providers, Chief Executive Officer and Payors How: Patient-Centric, Physician-Led, and Population Health Management Eric Atkins, CPA, MBA Lorie Glisson Focused Chief Financial Officer Chief Operating Officer Note: Presenters may include a subset of members presented on this page from both P3 Health Partners and Foresight Acquisition Corp. 5
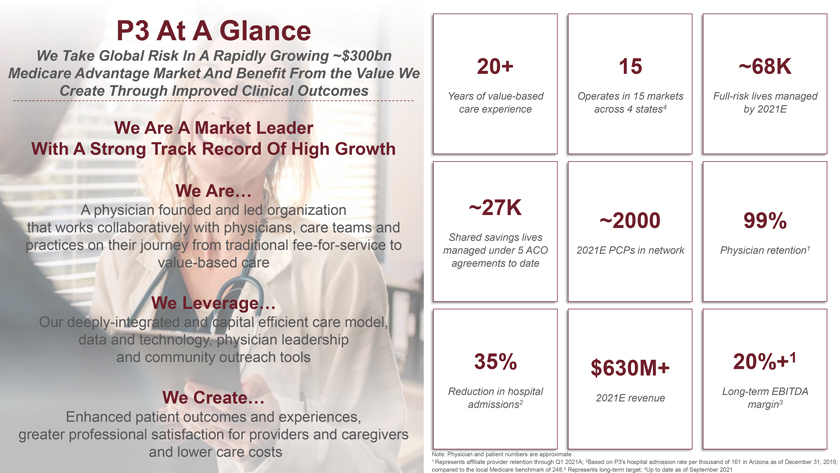
P3 At A Glance We Take Global Risk In A Rapidly Growing ~$300bn Medicare Advantage Market And Benefit From the Value We 20+ 15 ~68K Create Through Improved Clinical Outcomes Years of value-based Operates in 15 markets Full-risk lives managed care experience across 4 states4 by 2021E We Are A Market Leader With A Strong Track Record Of High Growth We Are… A physician founded and led organization ~27K that works collaboratively with physicians, care teams and ~2000 99% Shared savings lives practices on their journey from traditional fee-for-service to managed under 5 ACO 2021E PCPs in network Physician retention1 value-based care agreements to date We Leverage… Our deeply-integrated and capital efficient care model, data and technology, physician leadership and community outreach tools 35% 20%+1 $630M+ Reduction in hospital Long-term EBITDA We Create… 2021E revenue admissions2 margin3 Enhanced patient outcomes and experiences, greater professional satisfaction for providers and caregivers and lower care costs imate 1 Represents affiliate provider retention through Q1 2021A; 2Based on P3’s hospital admission rate per thousand of 161 in Arizona as of December 31, 2019, compared to the local Medicare benchmark of 248;3 Represents long-term target; 4Up to date as of September 2021
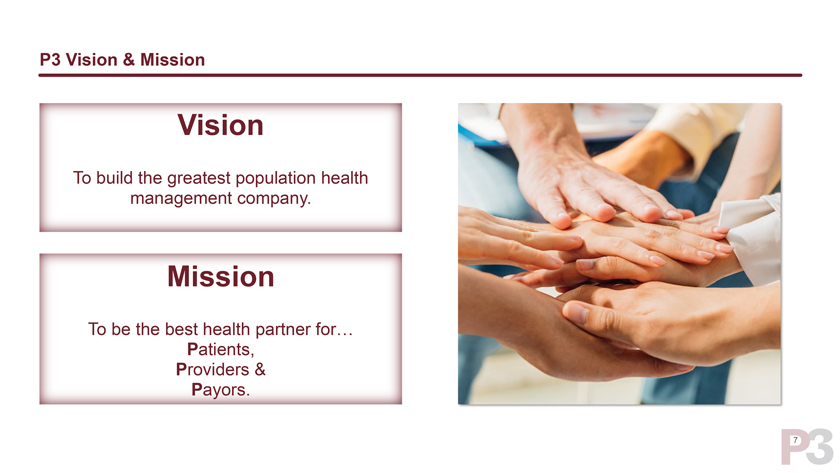
P3 Vision & Mission Vision To build the greatest population health management company. Mission To be the best health partner for… Patients, Providers & Payors. 7
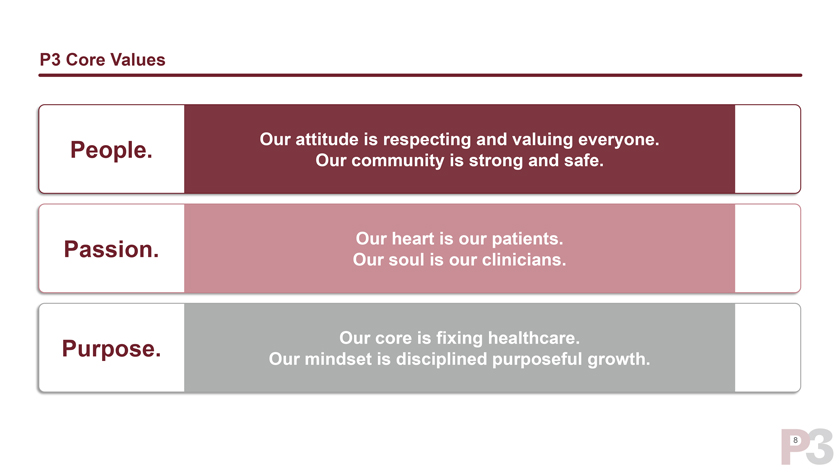
P3 Core Values People. Our attitude is respecting and valuing everyone. Our community is strong and safe. Passion. Our heart is our patients. Our soul is our clinicians. Purpose. Our core is fixing healthcare. Our mindset is disciplined purposeful growth. 8
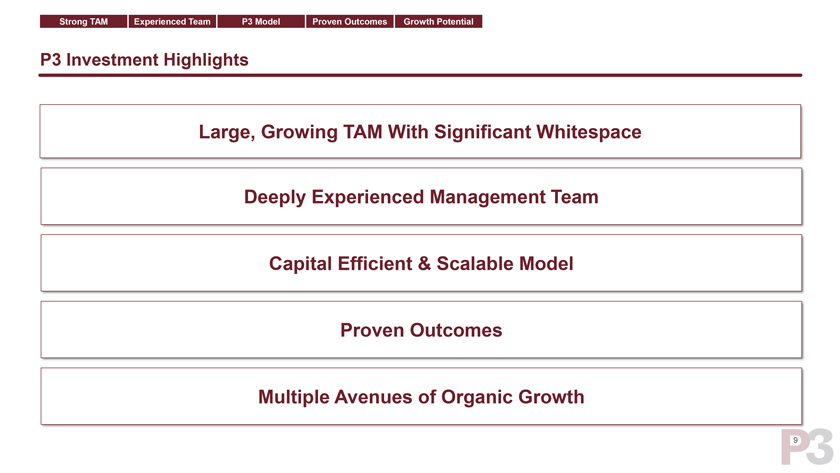
Strong TAM Experienced Team P3 Model Proven Outcomes Growth Potential P3 Investment Highlights Large, Growing TAM With Significant Whitespace Deeply Experienced Management Team Capital Efficient & Scalable Model Proven Outcomes Multiple Avenues of Organic Growth 9

Overview Health Partners people. Passion purpose
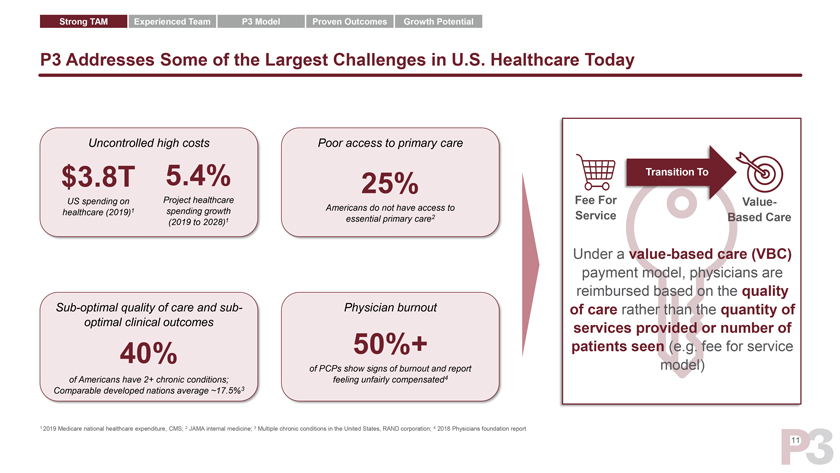
Strong TAM Experienced Team P3 Model Proven Outcomes Growth Potential P3 Addresses Some of the Largest Challenges in U.S. Healthcare Today Uncontrolled high costs Poor access to primary care $3.8T 5.4% 25% Transition To US spending on Project healthcare Americans do not have access to Fee For Value-healthcare (2019)1 spending growth essential primary care2 Service Based Care (2019 to 2028)1 Under a value-based care (VBC) payment model, physicians are reimbursed based on the quality Sub-optimal quality of care and sub- Physician burnout of care rather than the quantity of optimal clinical outcomes services provided or number of 40% 50%+ patients seen (e.g. fee for service of PCPs show signs of burnout and report model) of Americans have 2+ chronic conditions; feeling unfairly compensated4 Comparable developed nations average ~17.5%3 1 2019 Medicare national healthcare expenditure, CMS; 2 JAMA internal medicine; 3 Multiple chronic conditions in the United States, RAND corporation; 4 2018 Physicians foundation report 11
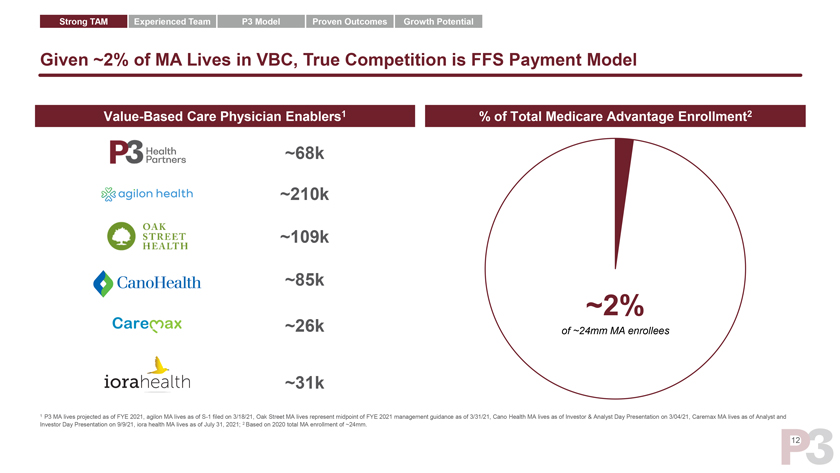
Strong TAM Experienced Team P3 Model Proven Outcomes Growth Potential Given ~2% of MA Lives in VBC, True Competition is FFS Payment Model Value-Based Care Physician Enablers1 % of Total Medicare Advantage Enrollment2 ~68k ~210k ~109k ~85k ~2% ~26k of ~24mm MA enrollees ~31k 1 P3 MA lives projected as of FYE 2021, agilon MA lives as of S-1 filed on 3/18/21, Oak Street MA lives represent midpoint of FYE 2021 management guidance as of 3/31/21, Cano Health MA lives as of Investor & Analyst Day Presentation on 3/04/21, Caremax MA lives as of Analyst and Investor Day Presentation on 9/9/21, iora health MA lives as of July 31, 2021; 2 Based on 2020 total MA enrollment of ~24mm. 12
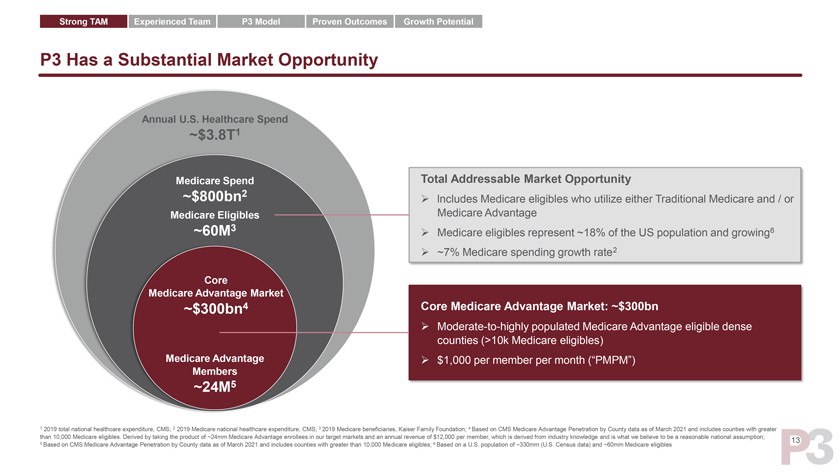
Strong TAM Experienced Team P3 Model Proven Outcomes Growth Potential P3 Has a Substantial Market Opportunity Annual U.S. Healthcare Spend ~$3.8T1 Medicare Spend Total Addressable Market Opportunity ~$800bn2 lncludes Medicare eligibles who utilize either Traditional Medicare and / or Medicare Eligibles Medicare Advantage ~60M3 Medicare eligibles represent ~18% of the US population and growing6 ~7% Medicare spending growth rate2 Core Medicare Advantage Market ~$300bn4 Core Medicare Advantage Market: ~$300bn Moderate-to-highly populated Medicare Advantage eligible dense counties (>10k Medicare eligibles) Medicare Advantage $1,000 per member per month (“PMPM”) Members ~24M5 1 2019 total national healthcare expenditure, CMS; 2 2019 Medicare national healthcare expenditure, CMS; 3 2019 Medicare beneficiaries, Kaiser Family Foundation; 4 Based on CMS Medicare Advantage Penetration by County data as of March 2021 and includes counties with greater than 10,000 Medicare eligibles. Derived by taking the product of ~24mm Medicare Advantage enrollees in our target markets and an annual revenue of $12,000 per member, which is derived from industry knowledge and is what we believe to be a reasonable national assumption; 13 5 Based on CMS Medicare Advantage Penetration by County data as of March 2021 and includes counties with greater than 10,000 Medicare eligibles; 6 Based on a U.S. population of ~330mm (U.S. Census data) and ~60mm Medicare eligibles
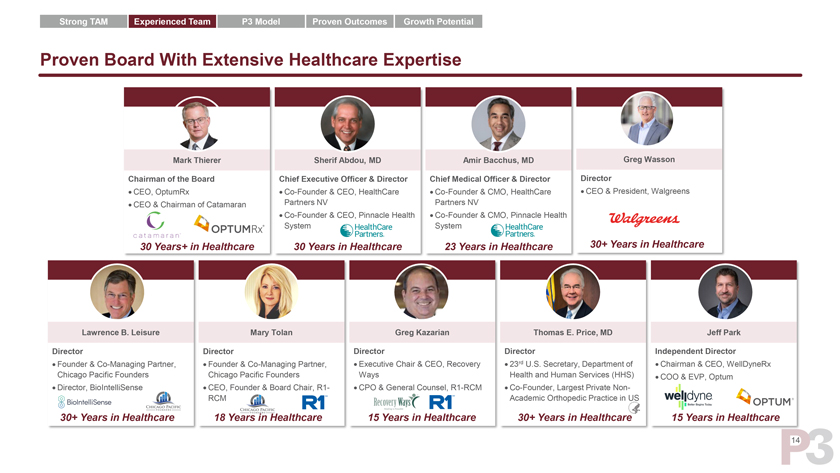
Strong TAM Experienced Team P3 Model Proven Outcomes Growth Potential Proven Board With Extensive Healthcare Expertise Mark Thierer Sherif Abdou, MD Amir Bacchus, MD Greg Wasson Chairman of the Board Chief Executive Officer & Director Chief Medical Officer & Director Director • CEO, OptumRx • Co-Founder & CEO, HealthCare • Co-Founder & CMO, HealthCare • CEO & President, Walgreens • CEO & Chairman of Catamaran Partners NV Partners NV • Co-Founder & C Health • Co-Founder & C Health System System 30 Years+ in Healthcare 30 Years i e 23 Years i e 30+ Years in Healthcare Lawrence B. Leisure Mary Tolan Greg Kazarian Thomas E. Price, MD Jeff Park Director Director Director Director Independent Director • Founder & Co-Managing Partner, • Founder & Co-Managing Partner, • Executive Chair & CEO, Recovery • 23rd U.S. Secretary, Department of • Chairman & CEO, WellDyneRx Chicago Pacific Founders Chicago Pacific Founders Ways Health and Human Services (HHS) • COO & EVP, Optum • Director, BioIntelliSense • CEO, Founder & Boar • CP RCM • Co-Founder, Largest Private Non-RCM Academic Orthopedic Practice in US 30+ Years in Healthcare 18 Years in Heal e 30+ Years in Healthcare 15 Years in Healthcare 14
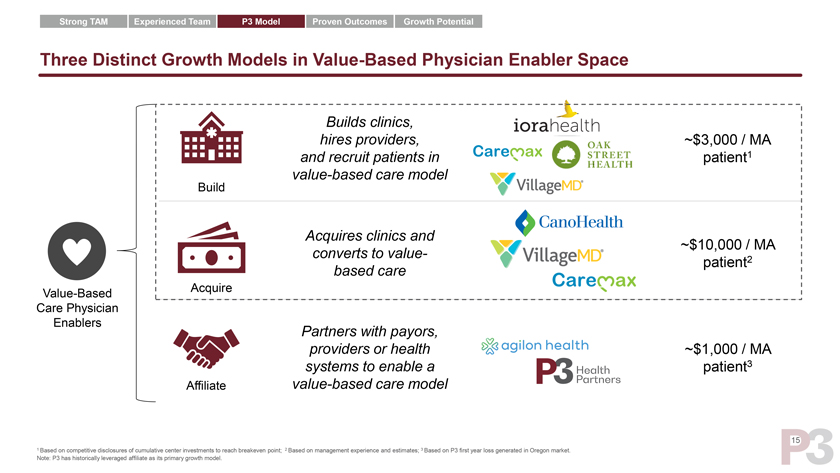
Strong TAM Experienced Team P3 Model Proven Outcomes Growth Potential Three Distinct Growth Models in Value-Based Physician Enabler Space Builds clinics, hires providers, ~$3,000 / MA and recruit patients in patient1 value-based care model Build Acquires clinics and ~$10,000 / MA converts to value-based care patient2 Acquire Value-Based Care Physician Enablers Partners with payors, providers or health ~$1,000 / MA systems to enable a patient3 Affiliate value-based care model 15 1 Based on competitive disclosures of cumulative center investments to reach breakeven point; 2 Based on management experience and estimates; 3 Based on P3 first year loss generated in Oregon market. Note: P3 has historically leveraged affiliate as its primary growth model.
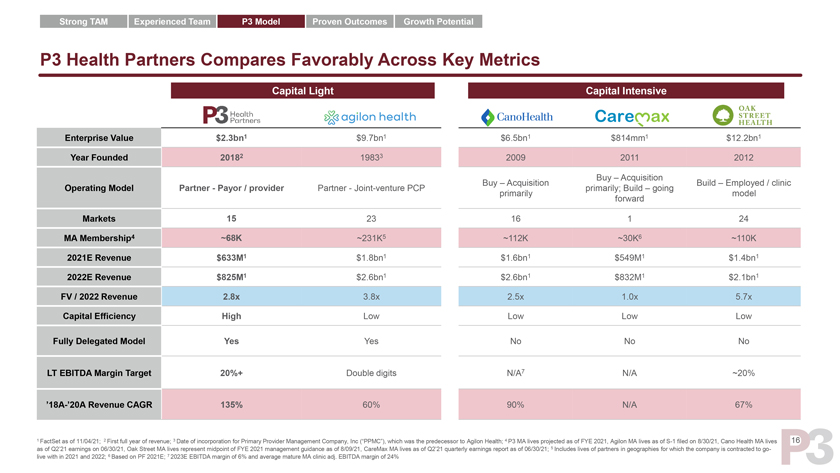
Strong TAM Experienced Team P3 Model Proven Outcomes Growth Potential P3 Health Partners Compares Favorably Across Key Metrics Capital Light Capital Intensive Enterprise Value $2.3bn1 $9.7bn1 $6.5bn1 $814mm1 $12.2bn1 Year Founded 20182 19833 2009 2011 2012 Buy – Acquisition Buy – Acquisition Build – Employed / clinic Operating Model Partner - Payor / provider Partner - Joint-venture PCP primarily; Build – going primarily model forward Markets 15 23 16 1 24 MA Membership4 ~68K ~231K5 ~112K ~30K6 ~110K 2021E Revenue $633M1 $1.8bn1 $1.6bn1 $549M1 $1.4bn1 2022E Revenue $825M1 $2.6bn1 $2.6bn1 $832M1 $2.1bn1 FV / 2022 Revenue 2.8x 3.8x 2.5x 1.0x 5.7x Capital Efficiency High Low Low Low Low Fully Delegated Model Yes Yes No No No LT EBITDA Margin Target 20%+ Double digits N/A7 N/A ~20% ‘18A-’20A Revenue CAGR 135% 60% 90% N/A 67% 1 FactSet as of 11/04/21; 2 First full year of revenue; 3 Date of incorporation for Primary Provider Management Company, Inc (“PPMC”), which was the predecessor to Agilon Health; 4 P3 MA lives projected as of FYE 2021, Agilon MA lives as of S-1 filed on 8/30/21, Cano Health MA lives 16 as of Q2’21 earnings on 06/30/21, Oak Street MA lives represent midpoint of FYE 2021 management guidance as of 8/09/21, CareMax MA lives as of Q2’21 quarterly earnings report as of 06/30/21; 5 Includes lives of partners in geographies for which the company is contracted to go-live with in 2021 and 2022; 6 Based on PF 2021E; 7 2023E EBITDA margin of 6% and average mature MA clinic adj. EBITDA margin of 24% 16
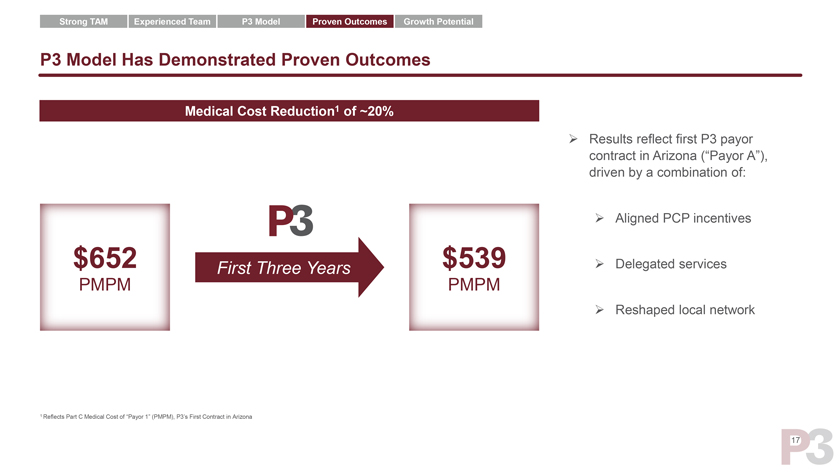
Strong TAM Experienced Team P3 Model Proven Outcomes Growth Potential P3 Model Has Demonstrated Proven Outcomes Medical Cost Reduction1 of ~20% ➢ Results reflect first P3 payor contract in Arizona (“Payor A”), driven by a combination of: ➢ Aligned PCP incentives $652 First Three Years $539 ➢ Delegated services PMPM PMPM ➢ Reshaped local network 1 Reflects Part C Medical Cost of “Payor 1” (PMPM), P3’s First Contract in Arizona 17
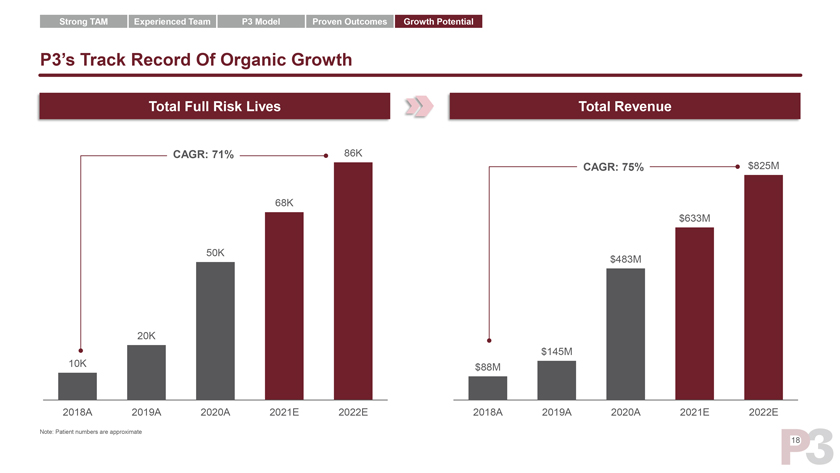
Strong TAM Experienced Team P3 Model Proven Outcomes Growth Potential P3’s Track Record Of Organic Growth Total Full Risk Lives Total Revenue CAGR: 71% 86K CAGR: 75% $825M 68K $633M 50K $483M 20K $145M 10K $88M 2018A 2019A 2020A 2021E 2022E 2018A 2019A 2020A 2021E 2022E Note: Patient numbers are approximate 18
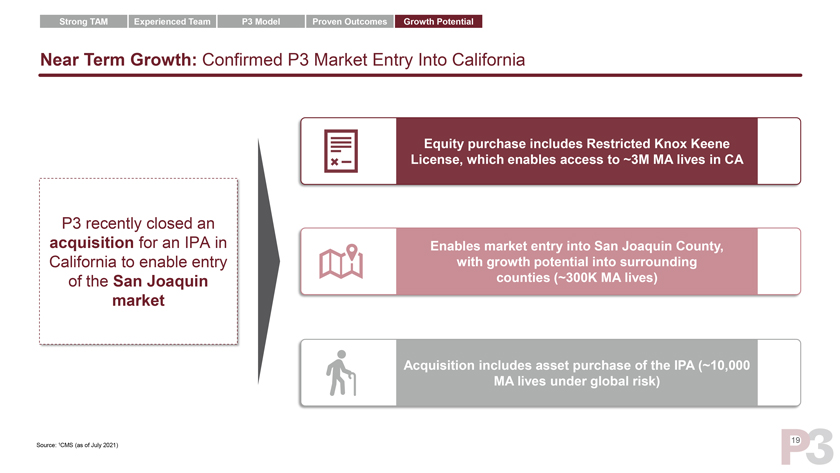
Strong TAM Experienced Team P3 Model Proven Outcomes Growth Potential Near Term Growth: Confirmed P3 Market Entry Into California Equity purchase includes Restricted Knox Keene License, which enables access to ~3M MA lives in CA P3 recently closed an acquisition for an IPA in Enables market entry into San Joaquin County, California to enable entry with growth potential into surrounding of the San Joaquin counties (~300K MA lives) market Acquisition includes asset purchase of the IPA (~10,000 MA lives under global risk) 19 Source: 1CMS (as of July 2021)

P3 Overview
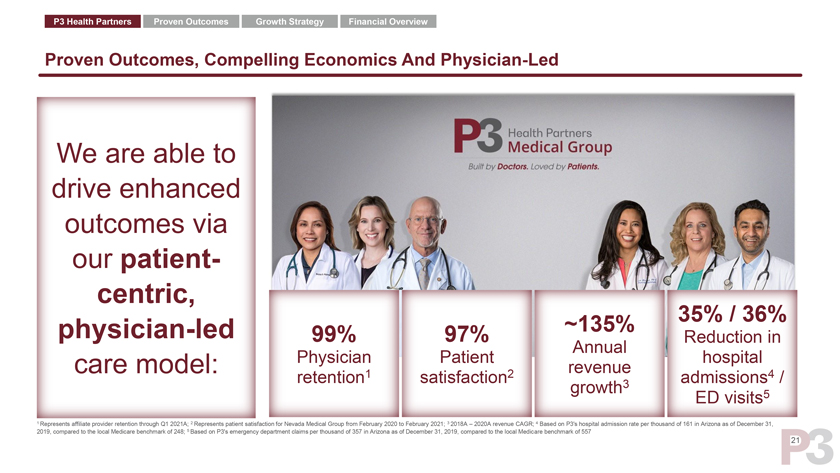
P3 Health Partners Proven Outcomes Growth Strategy Financial Overview Proven Outcomes, Compelling Economics And Physician-Led We are able to drive enhanced outcomes via our patient-centric, 35% / 36% physician-led ~135% 99% 97% Reduction in Annual Physician Patient hospital care model: 1 2 revenue 4 retention satisfaction 3 admissions / growth 5 ED visits 1 Represents affiliate provider retention through Q1 2021A; 2 Represents patient satisfaction for Nevada Medical Group from February 2020 to February 2021; 3 2018A – 2020A revenue CAGR; 4 Based on P3’s hospital admission rate per thousand of 161 in Arizona as of December 31, 2019, compared to the local Medicare benchmark of 248; 5 Based on P3’s emergency department claims per thousand of 357 in Arizona as of December 31, 2019, compared to the local Medicare benchmark of 557 21
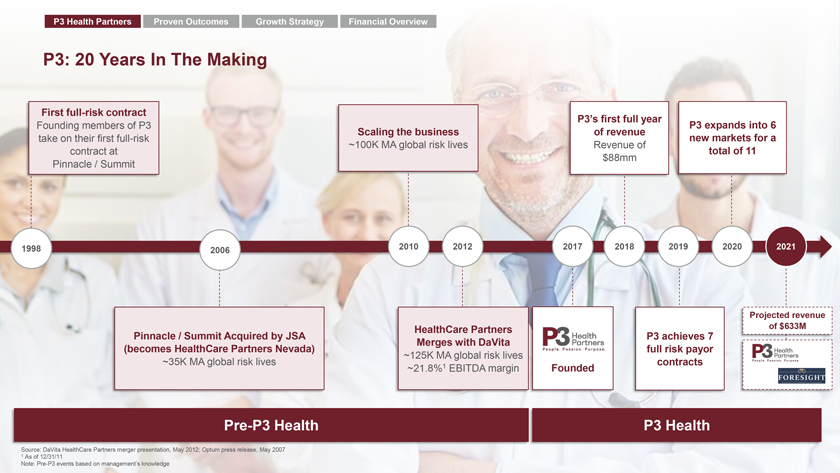
P3 Health Partners Proven Outcomes Growth Strategy Financial Overview P3: 20 Years In The Making First full-risk contract P3’s first full year Founding members of P3 P3 expands into 6 Scaling the business of revenue take on their first full-risk new markets for a ~100K MA global risk lives Revenue of contract at total of 11 $88mm Pinnacle / Summit 1998 2006 2010 2012 2017 2018 2019 2020 2021 Projected revenue HealthCare Partners of $633M Pinnacle / Summit Acquired by JSA P3 achieves 7 Merges with DaVita (becomes HealthCare Partners Nevada) full risk payor ~125K MA global risk lives ~35K MA global risk lives contracts ~21.8%1 EBITDA margin Founded Pre-P3 Health P3 Health Source: DaVita HealthCare Partners merger presentation, May 2012; Optum press release, May 2007 1 As of 12/31/11 Note: Pre-P3 events based on management’s knowledge
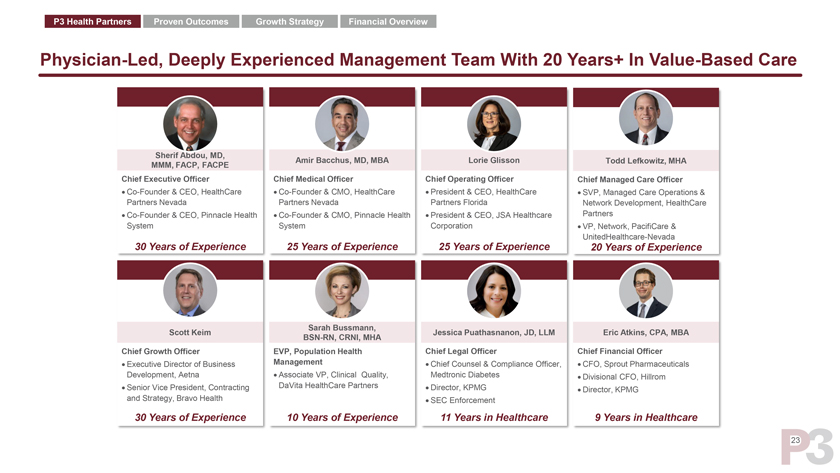
P3 Health Partners Proven Outcomes Growth Strategy Financial Overview Physician-Led, Deeply Experienced Management Team With 20 Years+ In Value-Based Care Sherif Abdou, MD, Amir Bacchus, MD, MBA Lorie Glisson Todd Lefkowitz, MHA MMM, FACP, FACPE Chief Executive Officer Chief Medical Officer Chief Operating Officer Chief Managed Care Officer • Co-Founder & CEO, HealthCare • Co-Founder & CMO, HealthCare • President & CEO, HealthCare • SVP, Managed Care Operations & Partners Nevada Partners Nevada Partners Florida Network Development, HealthCare • Co-Founder & CEO, Pinnacle Health • Co-Founder & CMO, Pinnacle Health • President & CEO, JSA Healthcare Partners System System Corporation • VP, Network, PacifiCare & UnitedHealthcare-Nevada 30 Years of Experience 25 Years of Experience 25 Years of Experience 20 Years of Experience Sarah Bussmann, Scott Keim Jessica Puathasnanon, JD, LLM Eric Atkins, CPA, MBA BSN-RN, CRNI, MHA Chief Growth Officer EVP, Population Health Chief Legal Officer Chief Financial Officer • Executive Director of Business Management • Chief Counsel & Compliance Officer, • CFO, Sprout Pharmaceuticals Development, Aetna • Associate VP, Clinical Quality, Medtronic Diabetes • Divisional CFO, Hillrom • Senior Vice President, Contracting DaVita HealthCare Partners • Director, KPMG • Director, KPMG and Strategy, Bravo Health • SEC Enforcement 30 Years of Experience 10 Years of Experience 11 Years in Healthcare 9 Years in Healthcare 23
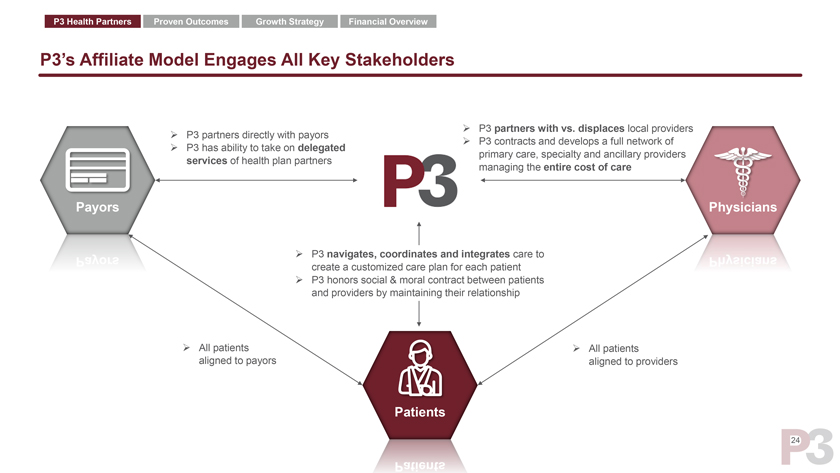
P3 Health Partners Proven Outcomes Growth Strategy Financial Overview P3’s Affiliate Model Engages All Key Stakeholders ➢ P3 partners with vs. displaces local providers ➢ P3 partners directly with payors ➢ P3 contracts and develops a full network of ➢ P3 has ability to take on delegated primary care, specialty and ancillary providers services of health plan partners managing the entire cost of care Payors Physicians ➢ P3 navigates, coordinates and integrates care to create a customized care plan for each patient ➢ P3 honors social & moral contract between patients and providers by maintaining their relationship ➢ All patients ➢ All patients aligned to payors aligned to providers Patients 24
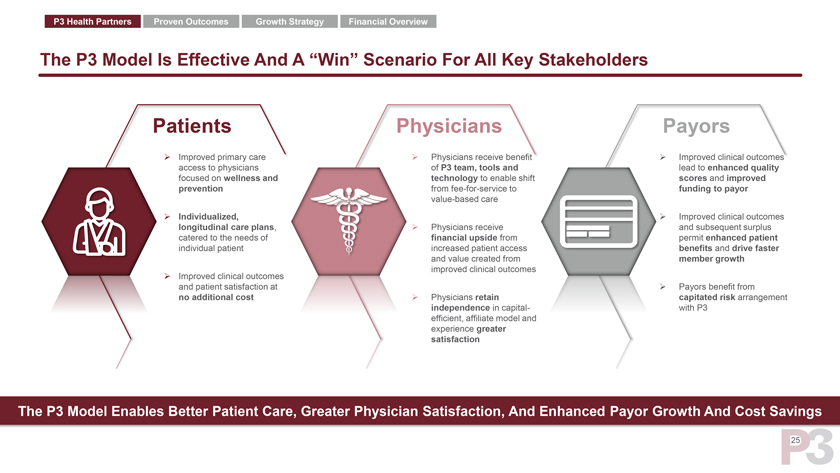
P3 Health Partners Proven Outcomes Growth Strategy Financial Overview Improved primary care access to physicians focused on wellness and prevention Individualized, longitudinal care plans, catered to the needs of individual patient Improved clinical outcomes and patient satisfaction at no additional cost Physicians receive benefit of P3 team, tools and technology to enable shift from fee-for-service to value-based care Physicians receive financial upside from increased patient access and value created from improved clinical outcomes Physicians retain independence in capital-efficient, affiliate model and experience greater payors Improved clinical outcomes lead to enhanced quality scores and improved funding to payor Improved clinical outcomes and subsequent surplus permit enhanced patient benefits and drive faster member growth Payors benefit from capitated risk arrangement with P3 The P3 Model Is Effective And A “Win” Scenario For All Key Stakeholders The P3 Model Enables Better Patient Care, Greater Physician Satisfaction, And Enhanced Payor Growth And Cost Savings 25
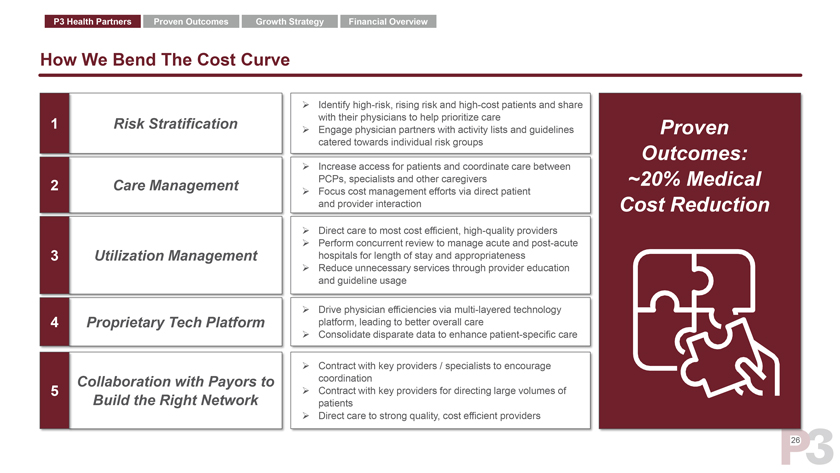
P3 Health Partners Proven Outcomes Growth Strategy Financial Overview How We Bend The Cost Curve ➢ Identify high-risk, rising risk and high-cost patients and share 1 Risk Stratification with their physicians to help prioritize care ➢ Engage physician partners with activity lists and guidelines Proven catered towards individual risk groups Outcomes: ➢ Increase access for patients and coordinate care between 2 Care Management PCPs, specialists and other caregivers ~20% Medical ➢ Focus cost management efforts via direct patient and provider interaction Cost Reduction ➢ Direct care to most cost efficient, high-quality providers ➢ Perform concurrent review to manage acute and post-acute 3 Utilization Management hospitals for length of stay and appropriateness ➢ Reduce unnecessary services through provider education and guideline usage ➢ Drive physician efficiencies via multi-layered technology 4 Proprietary Tech Platform platform, leading to better overall care ➢ Consolidate disparate data to enhance patient-specific care ➢ Contract with key providers / specialists to encourage Collaboration with Payors to coordination 5 ➢ Contract with key providers for directing large volumes of Build the Right Network patients ➢ Direct care to strong quality, cost efficient providers 26
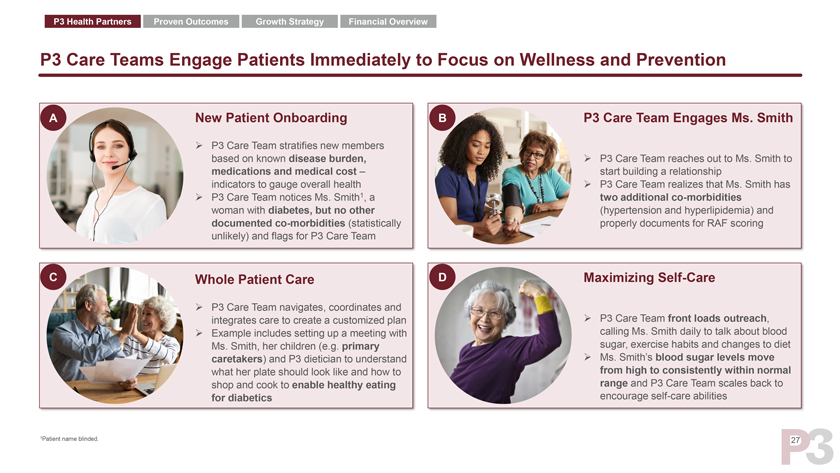
P3 Health Partners Proven Outcomes Growth Strategy Financial Overview P3 Care Teams Engage Patients Immediately to Focus on Wellness and Prevention A New Patient Onboarding B P3 Care Team Engages Ms. Smith P3 Care Team stratifies new members based on known disease burden, P3 Care Team reaches out to Ms. Smith to medications and medical cost – start building a relationship indicators to gauge overall health P3 Care Team realizes that Ms. Smith has P3 Care Team notices Ms. Smith1, a two additional co-morbidities woman with diabetes, but no other (hypertension and hyperlipidemia) and documented co-morbidities (statistically properly documents for RAF scoring unlikely) and flags for P3 Care Team C Whole Patient Care D Maximizing Self-Care P3 Care Team navigates, coordinates and integrates care to create a customized plan P3 Care Team front loads outreach, Example includes setting up a meeting with calling Ms. Smith daily to talk about blood Ms. Smith, her children (e.g. primary sugar, exercise habits and changes to diet caretakers) and P3 dietician to understand Ms. Smith’s blood sugar levels move what her plate should look like and how to from high to consistently within normal shop and cook to enable healthy eating range and P3 Care Team scales back to for diabetics encourage self-care abilities 1Patient name blinded. 27
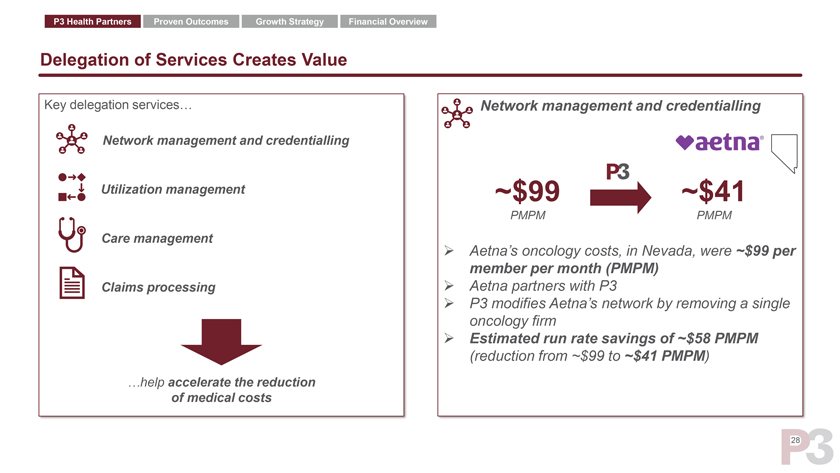
P3 Health Partners Proven Outcomes Growth Strategy Financial Overview Delegation of Services Creates Value Key delegation services… Network management and credentialling Network management and credentialling Utilization management ~$99 ~$41 PMPM PMPM Care management ➢ Aetna’s oncology costs, in Nevada, were ~$99 per member per month (PMPM) Claims processing ➢ Aetna partners with P3 ➢ P3 modifies Aetna’s network by removing a single oncology firm ➢ Estimated run rate savings of ~$58 PMPM (reduction from ~$99 to ~$41 PMPM) …help accelerate the reduction of medical costs 28
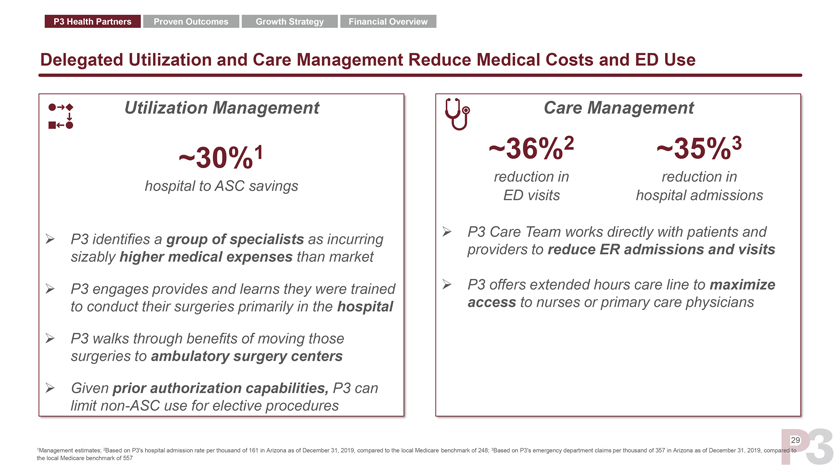
P3 Health Partners Proven Outcomes Growth Strategy Financial Overview Delegated Utilization and Care Management Reduce Medical Costs and ED Use Utilization Management Care Management ~36%2 ~35%3 ~30%1 reduction in reduction in hospital to ASC savings ED visits hospital admissions ➢ P3 Care Team works directly with patients and ➢ P3 identifies a group of specialists as incurring providers to reduce ER admissions and visits sizably higher medical expenses than market ➢ P3 engages provides and learns they were trained ➢ P3 offers extended hours care line to maximize to conduct their surgeries primarily in the hospital access to nurses or primary care physicians ➢ P3 walks through benefits of moving those surgeries to ambulatory surgery centers ➢ Given prior authorization capabilities, P3 can limit non-ASC use for elective procedures 29 1Management estimates; 2Based on P3’s hospital admission rate per thousand of 161 in Arizona as of December 31, 2019, compared to the local Medicare benchmark of 248; 3Based on P3’s emergency department claims per thousand of 357 in Arizona as of December 31, 2019, compared to the local Medicare benchmark of 557
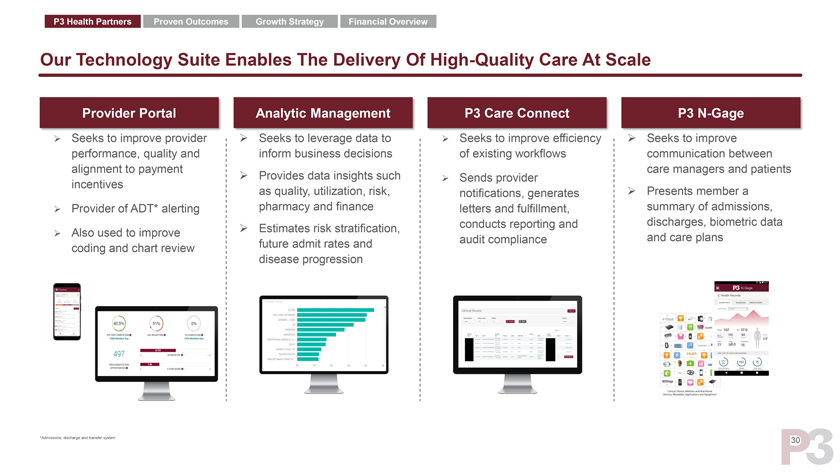
P3 Health Partners Proven Outcomes Growth Strategy Financial Overview Our Technology Suite Enables The Delivery Of High-Quality Care At Scale Provider Portal Analytic Management P3 Care Connect P3 N-Gage ➢ Seeks to improve provider ➢ Seeks to leverage data to ➢ Seeks to improve efficiency ➢ Seeks to improve performance, quality and inform business decisions of existing workflows communication between alignment to payment care managers and patients ➢ Provides data insights such ➢ Sends provider incentives as quality, utilization, risk, notifications, generates ➢ Presents member a ➢ Provider of ADT* alerting pharmacy and finance letters and fulfillment, summary of admissions, conducts reporting and discharges, biometric data ➢ Estimates risk stratification, ➢ Also used to improve and care plans future admit rates and audit compliance coding and chart review disease progression *Admissions, discharge and transfer system 30
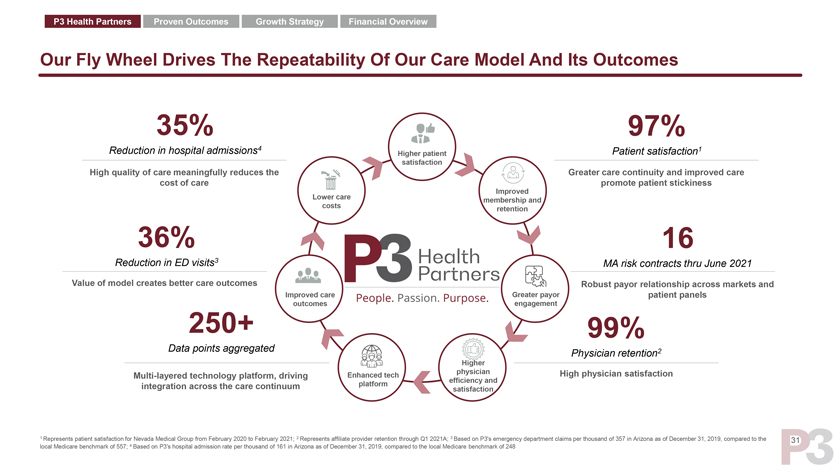
P3 Health Partners Proven Outcomes Growth Strategy Financial Overview Our Fly Wheel Drives The Repeatability Of Our Care Model And Its Outcomes 35% 97% Reduction in hospital admissions4 Patient satisfaction1 Higher patient satisfaction High quality of care meaningfully reduces the Greater care continuity and improved care cost of care promote patient stickiness Improved Lower care membership and costs retention 36% 16 Reduction in ED visits3 Value of model creates better care outcomes Robust payor relationship across markets and Improved care Greater payor patient panels outcomes engagement 250+ 99% Data points aggregated 2 Physician retention Higher physician High physician satisfaction Multi-layered technology platform, driving Enhanced tech efficiency and integration across the care continuum platform satisfaction 1 Represents patient satisfaction for Nevada Medical Group from February 20 and of 357 in Arizona as of December 31, 2019, compared to the 31 local Medicare benchmark of 557; 4 Based on P3’s hospital admission rate per

Proven Outcomes
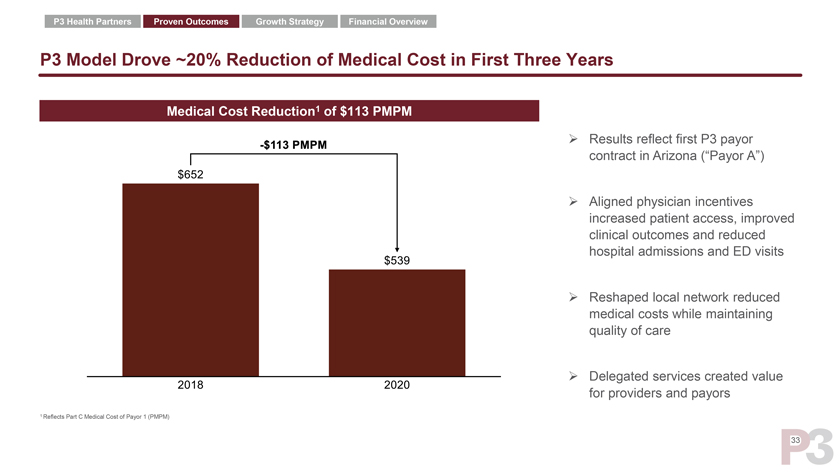
P3 Health Partners Proven Outcomes Growth Strategy Financial Overview P3 Model Drove ~20% Reduction of Medical Cost in First Three Years Medical Cost Reduction1 of $113 PMPM ➢ Results reflect first P3 payor contract in Arizona (“Payor A”) ➢ Aligned physician incentives increased patient access, improved clinical outcomes and reduced hospital admissions and ED visits ➢ Reshaped local network reduced medical costs while maintaining quality of care ➢ Delegated services created value for providers and payors 1 Reflects Part C Medical Cost of Payor 1 (PMPM) 33
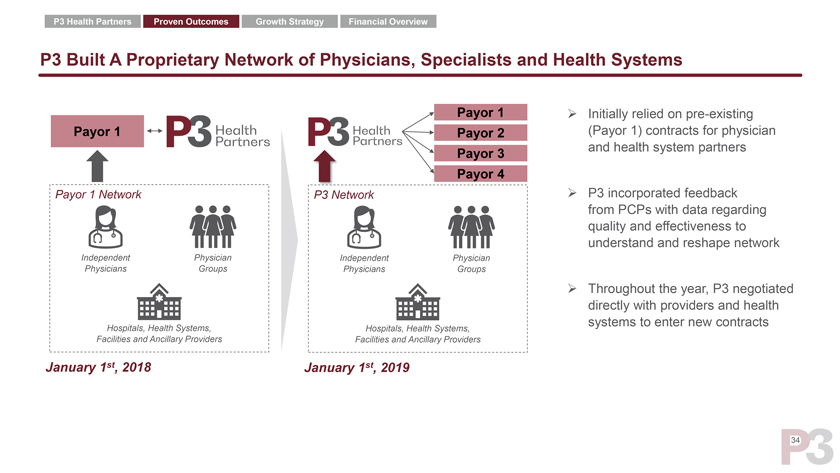
P3 Health Partners Proven Outcomes Growth Strategy Financial Overview P3 Built A Proprietary Network of Physicians, Specialists and Health Systems Payor 1 ➢ Initially relied on pre-existing Payor 1 Payor 2 (Payor 1) contracts for physician and health system partners Payor 3 Payor 4 Payor 1 Network P3 Network ➢ P3 incorporated feedback from PCPs with data regarding quality and effectiveness to understand and reshape network Independent Physician Independent Physician Physicians Groups Physicians Groups ➢ Throughout the year, P3 negotiated directly with providers and health systems to enter new contracts Hospitals, Health Systems, Hospitals, Health Systems, Facilities and Ancillary Providers Facilities and Ancillary Providers January 1st, 2018 January 1st, 2019 34
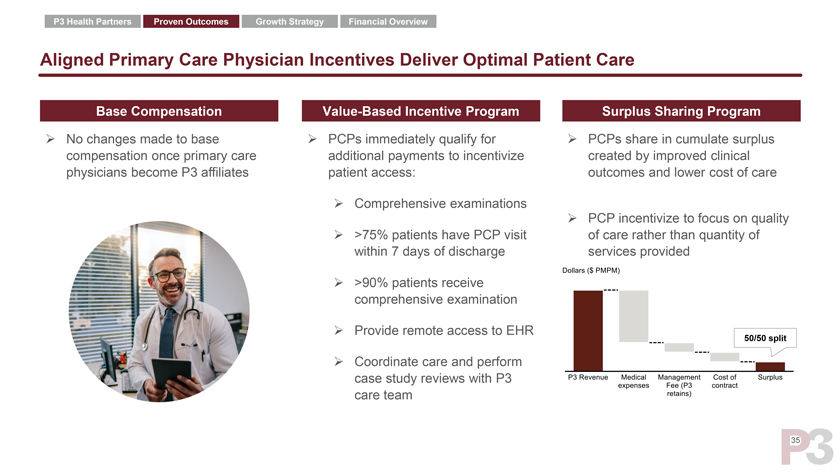
P3 Health Partners Proven Outcomes Growth Strategy Financial Overview Aligned Primary Care Physician Incentives Deliver Optimal Patient Care Base Compensation Value-Based Incentive Program Surplus Sharing Program ➢ No changes made to base ➢ PCPs immediately qualify for ➢ PCPs share in cumulate surplus compensation once primary care additional payments to incentivize created by improved clinical physicians become P3 affiliates patient access: outcomes and lower cost of care ➢ Comprehensive examinations ➢ PCP incentivize to focus on quality ➢ >75% patients have PCP visit of care rather than quantity of within 7 days of discharge services provided ➢ >90% patients receive comprehensive examination ➢ Provide remote access to EHR 50/50 split ➢ Coordinate care and perform case study reviews with P3 care team 35
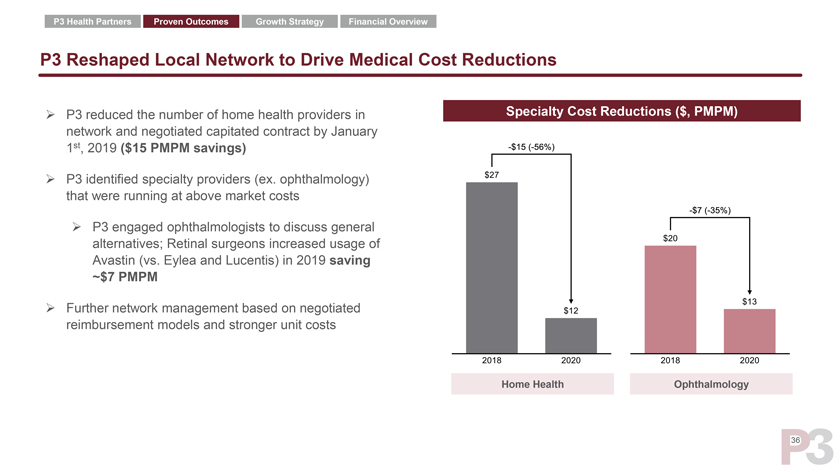
P3 Health Partners Proven Outcomes Growth Strategy Financial Overview P3 Reshaped Local Network to Drive Medical Cost Reductions ➢ P3 reduced the number of home health providers in Specialty Cost Reductions ($, PMPM) network and negotiated capitated contract by January 1st, 2019 ($15 PMPM savings) ➢ P3 identified specialty providers (ex. ophthalmology) that were running at above market costs ➢ P3 engaged ophthalmologists to discuss general alternatives; Retinal surgeons increased usage of Avastin (vs. Eylea and Lucentis) in 2019 saving ~$7 PMPM ➢ Further network management based on negotiated reimbursement models and stronger unit costs Home Health Ophthalmology 36
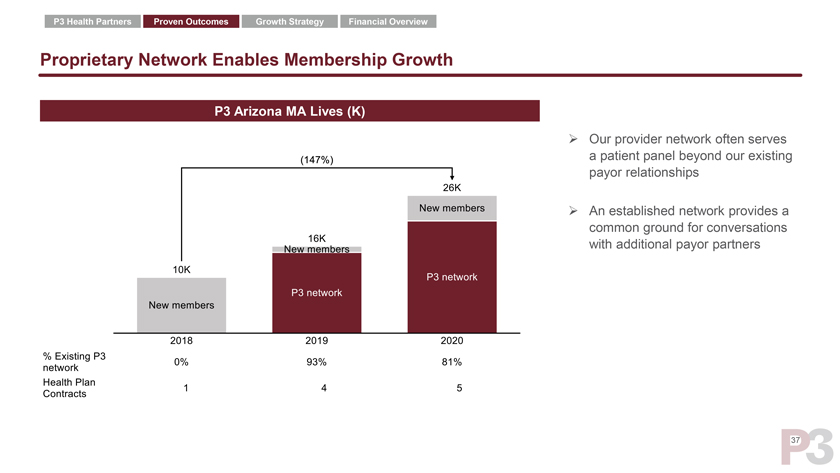
P3 Health Partners Proven Outcomes Growth Strategy Financial Overview Proprietary Network Enables Membership Growth P3 Arizona MA Lives (K) ➢ Our provider network often serves a patient panel beyond our existing payor relationships ➢ An established network provides a common ground for conversations with additional payor partners 37
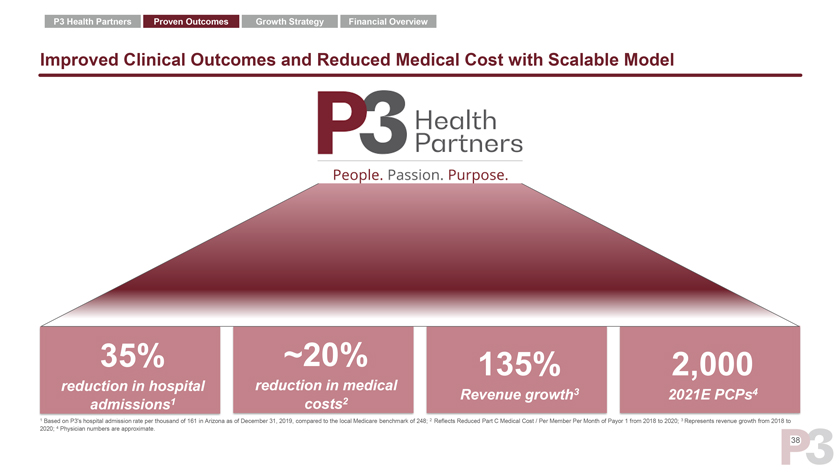
P3 Health Partners Proven Outcomes Growth Strategy Financial Overview Improved Clinical Outcomes and Reduced Medical Cost with Scalable Model “ “ “ “ “ “ 35% ~20% 135% 2,000 reduction in hospital reduction in medical Revenue growth3 2021E PCPs4 admissions1 costs2 1 Based on P3’s hospital admission rate per thousand of 161 in Arizona as of December 31, 2019, compared to the local Medicare benchmark of 248; 2 Reflects Reduced Part C Medical Cost / Per Member Per Month of Payor 1 from 2018 to 2020; 3 Represents revenue growth from 2018 to 2020; 4 Physician numbers are approximate. 38

Growth Strategy
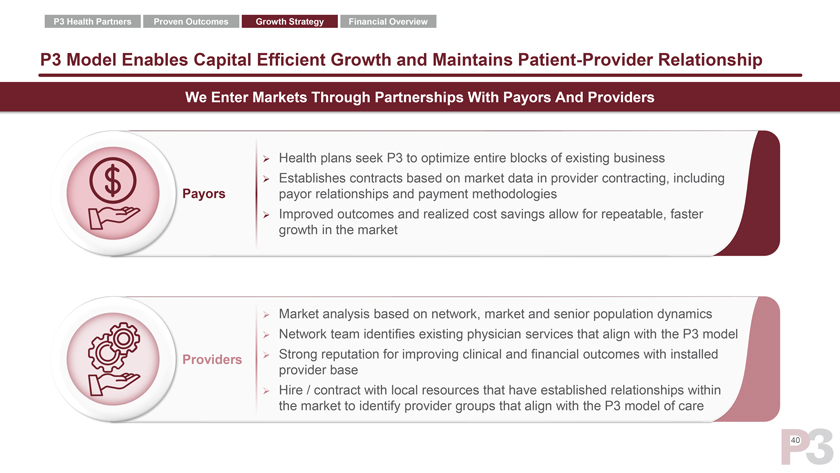
P3 Health Partners Proven Outcomes Growth Strategy Financial Overview P3 Model Enables Capital Efficient Growth and Maintains Patient-Provider Relationship We Enter Markets Through Partnerships With Payors And Providers Health plans seek P3 to optimize entire blocks of existing business Establishes contracts based on market data in provider contracting, including Payors payor relationships and payment methodologies Improved outcomes and realized cost savings allow for repeatable, faster growth in the market Market analysis based on network, market and senior population dynamics Network team identifies existing physician services that align with the P3 model Providers Strong reputation for improving clinical and financial outcomes with installed provider base Hire / contract with local resources that have established relationships within the market to identify provider groups that align with the P3 model of care 40
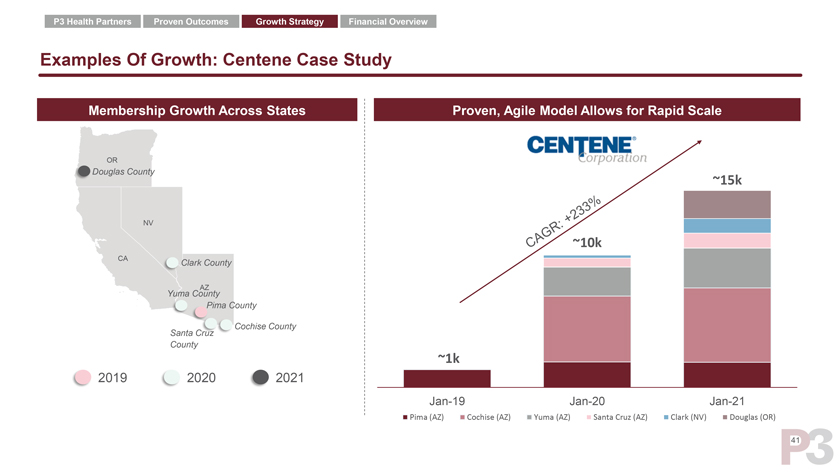
P3 Health Partners Proven Outcomes Growth Strategy Financial Overview Examples Of Growth: Centene Case Study Membership Growth Across States Proven, Agile Model Allows for Rapid Scale OR Douglas County ~15k NV ~10k CA Clark County AZ Yuma County Pima County Cochise County Santa Cruz County ~1k 2019 2020 2021 Jan-19 Jan-20 Jan-21 Pima (AZ) Cochise (AZ) Yuma (AZ) Santa Cruz (AZ) Clark (NV) Douglas (OR) 41
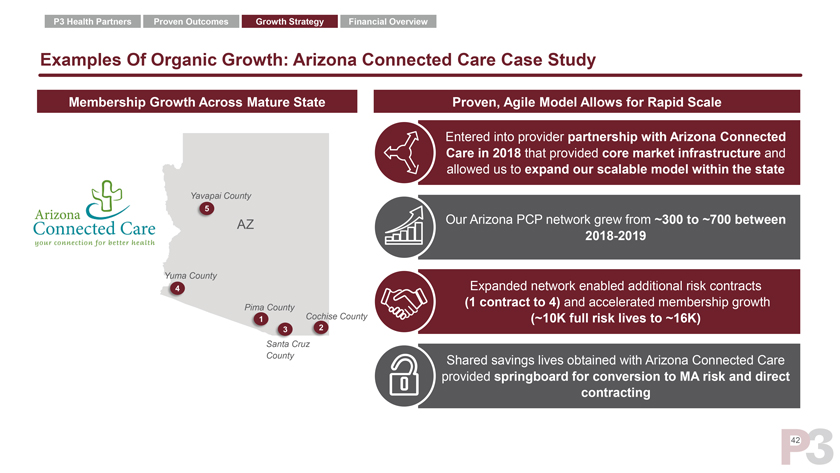
P3 Health Partners Proven Outcomes Growth Strategy Financial Overview Examples Of Organic Growth: Arizona Connected Care Case Study Membership Growth Across Mature State Proven, Agile Model Allows for Rapid Scale Entered into provider partnership with Arizona Connected Care in 2018 that provided core market infrastructure and allowed us to expand our scalable model within the state Yavapai County 5 AZ Our Arizona PCP network grew from ~300 to ~700 between 2018-2019 Yuma County Expanded network enabled additional risk contracts 4 (1 contract to 4) and accelerated membership growth Pima County 1 Cochise County (~10K full risk lives to ~16K) 3 2 Santa Cruz County Shared savings lives obtained with Arizona Connected Care provided springboard for conversion to MA risk and direct contracting 42
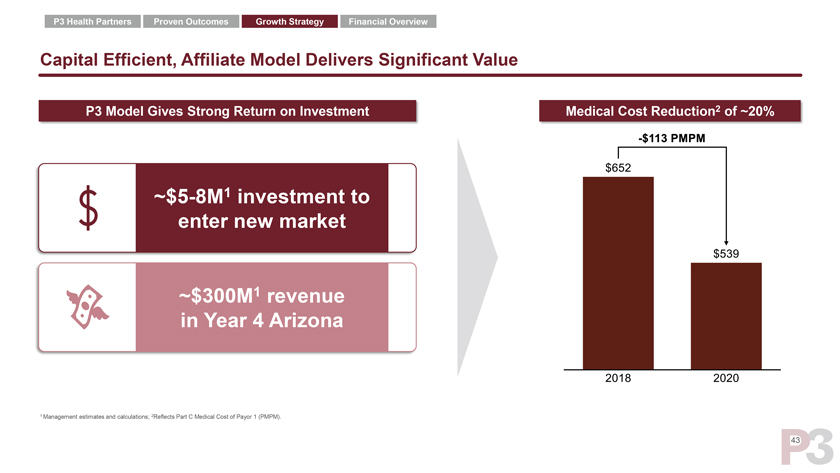
P3 Health Partners Proven Outcomes Growth Strategy Financial Overview Capital Efficient, Affiliate Model Delivers Significant Value P3 Model Gives Strong Return on Investment Medical Cost Reduction2 of ~20% ~$5-8M1 investment to enter new market ~$300M1 revenue in Year 4 Arizona 1 Management estimates and calculations; 2Reflects Part C Medical Cost of Payor 1 (PMPM). 43
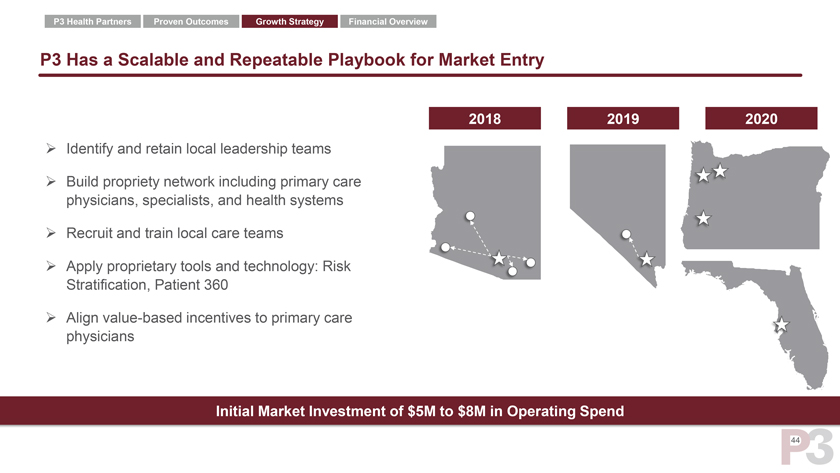
P3 Health Partners Proven Outcomes Growth Strategy Financial Overview P3 Has a Scalable and Repeatable Playbook for Market Entry 2018 2019 2020 Identify and retain local leadership teams Build propriety network including primary care physicians, specialists, and health systems Recruit and train local care teams Apply proprietary tools and technology: Risk Stratification, Patient 360 Align value-based incentives to primary care physicians Initial Market Investment of $5M to $8M in Operating Spend 44
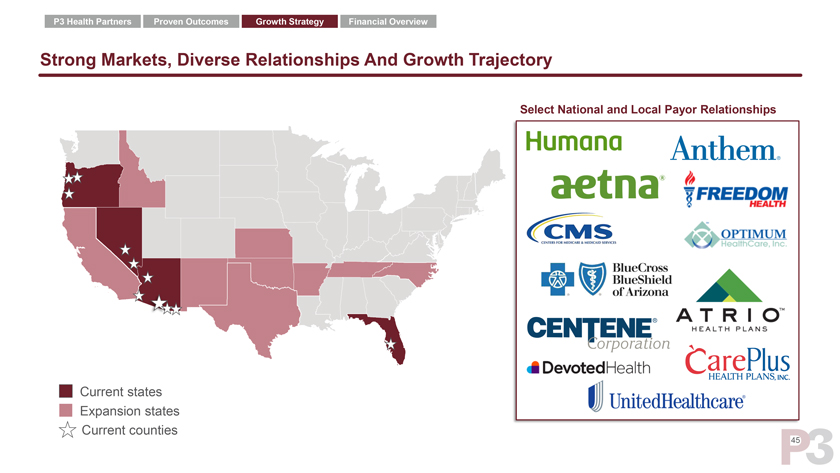
P3 Health Partners Proven Outcomes Growth Strategy Financial Overview Strong Markets, Diverse Relationships And Growth Trajectory Select National and Local Payor Relationships Current states Expansion states Current counties 45

Financial Overview
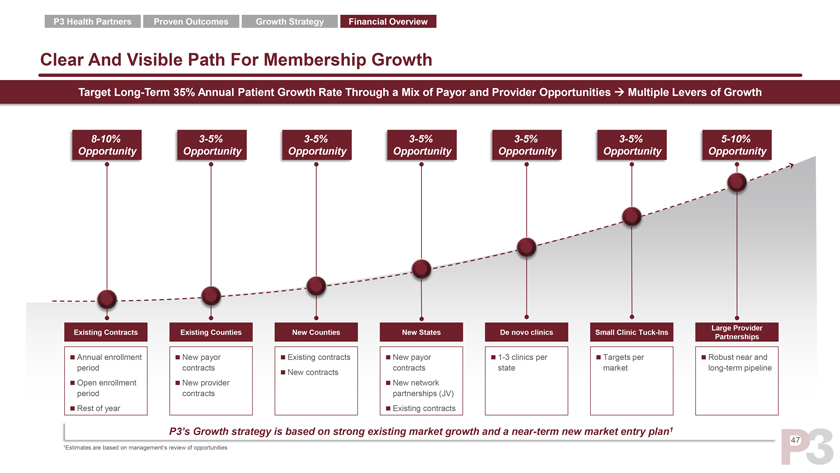
P3 Health Partners Proven Outcomes Growth Strategy Financial Overview Clear And Visible Path For Membership Growth Target Long-Term 35% Annual Patient Growth Rate Through a Mix of Payor and Provider Opportunities Multiple Levers of Growth 8-10% 3-5% 3-5% 3-5% 3-5% 3-5% 5-10% Opportunity Opportunity Opportunity Opportunity Opportunity Opportunity Opportunity Large Provider Existing Contracts Existing Counties New Counties New States De novo clinics Small Clinic Tuck-Ins Partnerships Annual enrollment New payor Existing contracts New payor 1-3 clinics per Targets per Robust near and period contracts contracts state market long-term pipeline New contracts Open enrollment New provider New network period contracts partnerships (JV) Rest of year Existing contracts P3’s Growth strategy is based on strong existing market growth and a near-term new market entry plan1 47 1Estimates are based on management’s review of opportunities
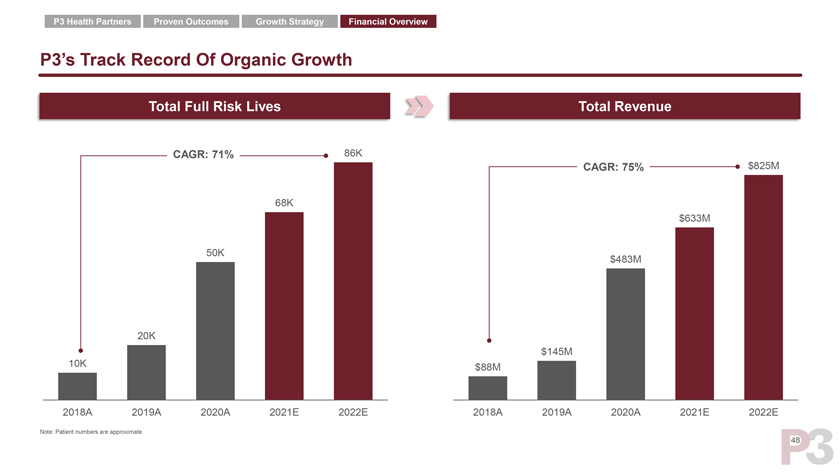
P3 Health Partners Proven Outcomes Growth Strategy Financial Overview P3’s Track Record Of Organic Growth Total Full Risk Lives Total Revenue CAGR: 71% 86K CAGR: 75% $825M 68K $633M 50K $483M 20K $145M 10K $88M 2018A 2019A 2020A 2021E 2022E 2018A 2019A 2020A 2021E 2022E Note: Patient numbers are approximate 48
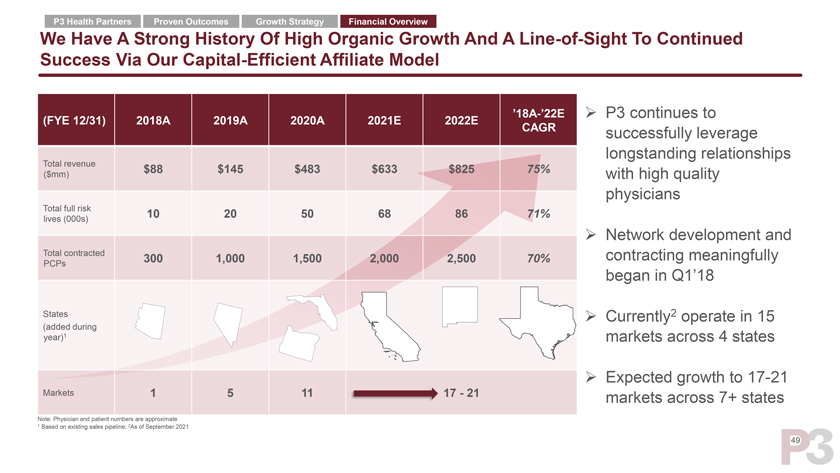
P3 Health Partners Proven Outcomes Growth Strategy Financial Overview We Have A Strong History Of High Organic Growth And A Line-of-Sight To Continued Success Via Our Capital-Efficient Affiliate Model ’18A-’22E P3 continues to (FYE 12/31) 2018A 2019A 2020A 2021E 2022E CAGR successfully leverage Total revenue longstanding relationships $88 $145 $483 $633 $825 75% ($mm) with high quality physicians Total full risk 10 20 50 68 86 71% lives (000s) Network development and Total contracted 300 1,000 1,500 2,000 2,500 70% contracting meaningfully PCPs began in Q1’18 States Currently2 operate in 15 (added during year)1 markets across 4 states Expected growth to 17-21 Markets 1 5 11 17—21 markets across 7+ states Note: Physician and patient numbers are approximate 1 Based on existing sales pipeline; 2As of September 2021 49
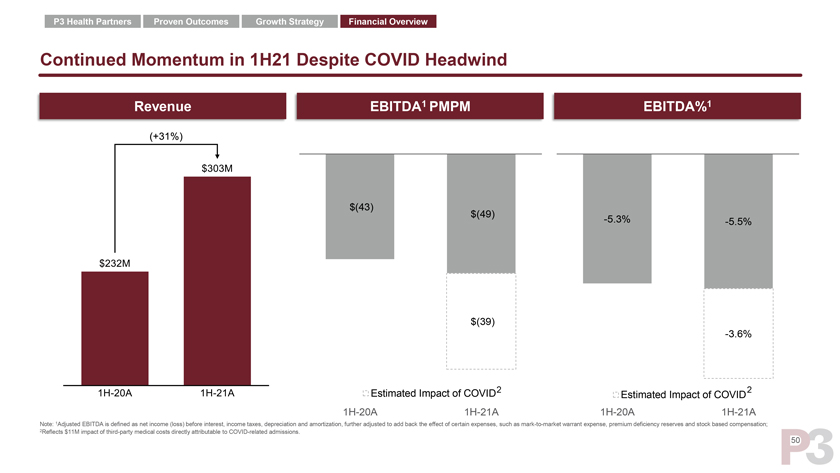
P3 Health Partners Proven Outcomes Growth Strategy Financial Overview Continued Momentum in 1H21 Despite COVID Headwind Revenue EBITDA1 PMPM EBITDA%1 $(43) $(49) -5.3% -5.5% $(39) -3.6% Estimated Impact of COVID2 2 Estimated Impact of COVID 1H-20A 1H-21A 1H-20A 1H-21A Note: 1Adjusted EBITDA is defined as net income (loss) before interest, income taxes, depreciation and amortization, further adjusted to add back the effect of certain expenses, such as mark-to-market warrant expense, premium deficiency reserves and stock based compensation; 2Reflects $11M impact of third-party medical costs directly attributable to COVID-related admissions. 50
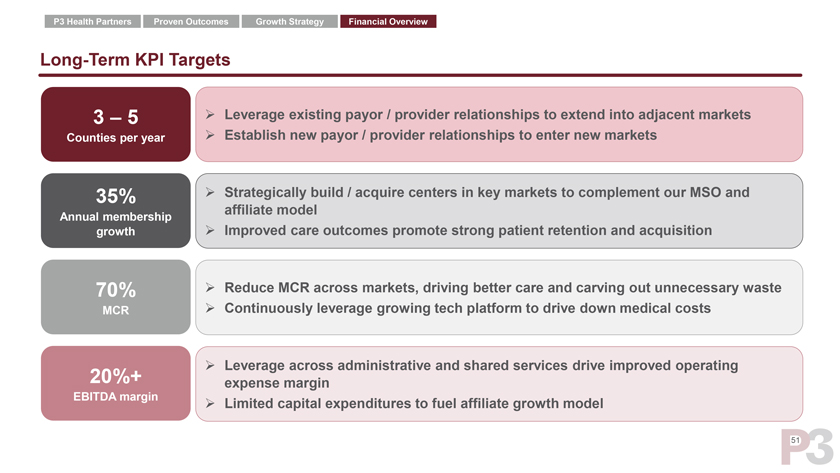
P3 Health Partners Proven Outcomes Growth Strategy Financial Overview Long-Term KPI Targets 3 – 5 ➢ Leverage existing payor / provider relationships to extend into adjacent markets Counties per year ➢ Establish new payor / provider relationships to enter new markets 35% ➢ Strategically build / acquire centers in key markets to complement our MSO and affiliate model Annual membership growth ➢ Improved care outcomes promote strong patient retention and acquisition 70% ➢ Reduce MCR across markets, driving better care and carving out unnecessary waste MCR ➢ Continuously leverage growing tech platform to drive down medical costs ➢ Leverage across administrative and shared services drive improved operating 20%+ expense margin EBITDA margin ➢ Limited capital expenditures to fuel affiliate growth model 51
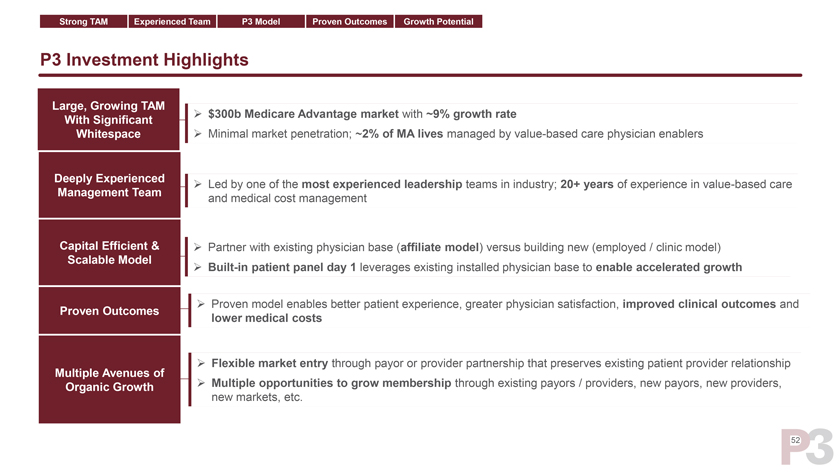
Strong TAM Experienced Team P3 Model Proven Outcomes Growth Potential P3 Investment Highlights Large, Growing TAM ➢ $300b Medicare Advantage market with ~9% growth rate With Significant Whitespace ➢ Minimal market penetration; ~2% of MA lives managed by value-based care physician enablers Deeply Experienced ➢ Led by one of the most experienced leadership teams in industry; 20+ years of experience in value-based care Management Team and medical cost management Capital Efficient & ➢ Partner with existing physician base (affiliate model) versus building new (employed / clinic model) Scalable Model ➢ Built-in patient panel day 1 leverages existing installed physician base to enable accelerated growth ➢ Proven model enables better patient experience, greater physician satisfaction, improved clinical outcomes and Proven Outcomes lower medical costs Multiple Avenues of ➢ Flexible market entry through payor or provider partnership that preserves existing patient provider relationship Organic Growth ➢ Multiple opportunities to grow membership through existing payors / providers, new payors, new providers, new markets, etc. 52
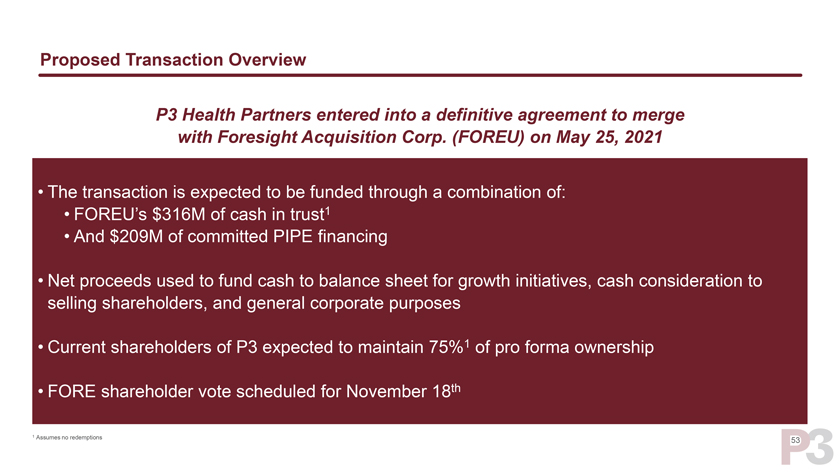
Proposed Transaction Overview P3 Health Partners entered into a definitive agreement to merge with Foresight Acquisition Corp. (FOREU) on May 25, 2021 • The transaction is expected to be funded through a combination of: • FOREU’s $316M of cash in trust1 • And $209M of committed PIPE financing • Net proceeds used to fund cash to balance sheet for growth initiatives, cash consideration to selling shareholders, and general corporate purposes • Current shareholders of P3 expected to maintain 75%1 of pro forma ownership • FORE shareholder vote scheduled for November 18th 1 Assumes no redemptions 53

Appendix
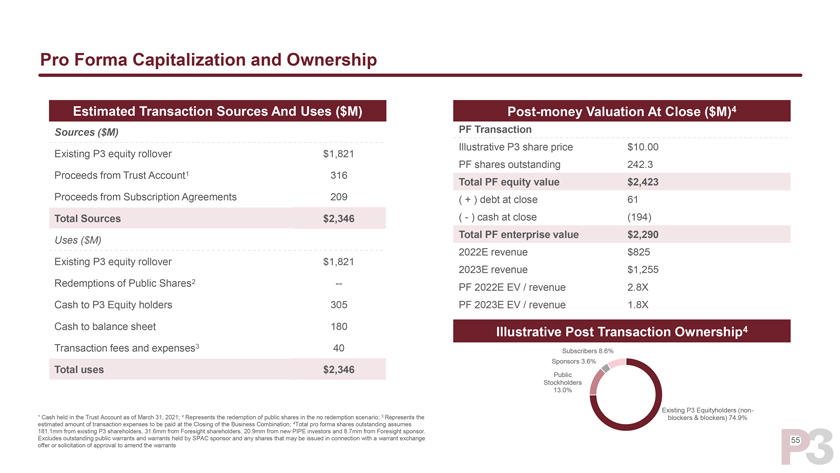
Pro Forma Capitalization and Ownership Estimated Transaction Sources And Uses ($M) Post-money Valuation At Close ($M)4 Sources ($M) PF Transaction Illustrative P3 share price $10.00 Existing P3 equity rollover $1,821 PF shares outstanding 242.3 Proceeds from Trust Account1 316 Total PF equity value $2,423 Proceeds from Subscription Agreements 209 ( + ) debt at close 61 Total Sources $2,346 (—) cash at close (194) Total PF enterprise value $2,290 Uses ($M) 2022E revenue $825 Existing P3 equity rollover $1,821 2023E revenue $1,255 Redemptions of Public Shares2 --PF 2022E EV / revenue 2.8X Cash to P3 Equity holders 305 PF 2023E EV / revenue 1.8X Cash to balance sheet 180 Illustrative Post Transaction Ownership4 Transaction fees and expenses3 40 Subscribers 8.6% Sponsors 3.6% Total uses $2,346 Public Stockholders 13.0% Existing P3 Equityholders (non- ¹ Cash held in the Trust Account as of March 31, 2021; ² Represents the redemption of public shares in the no redemption scenario; 3 Represents the blockers & blockers) 74.9% estimated amount of transaction expenses to be paid at the Closing of the Business Combination; 4Total pro forma shares outstanding assumes 181.1mm from existing P3 shareholders, 31.6mm from Foresight shareholders, 20.9mm from new PIPE investors and 8.7mm from Foresight sponsor. Excludes outstanding public warrants and warrants held by SPAC sponsor and any shares that may be issued in connection with a warrant exchange 55 offer or solicitation of approval to amend the warrants
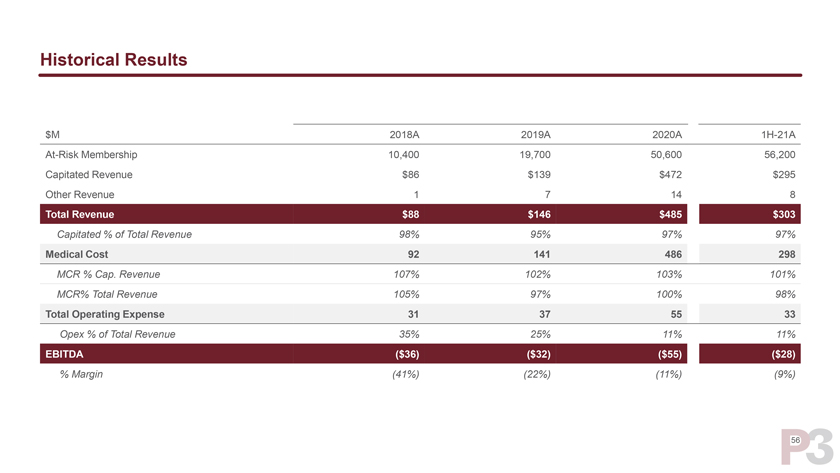
Historical Results $M 2018A 2019A 2020A 1H-21A At-Risk Membership 10,400 19,700 50,600 56,200 Capitated Revenue $86 $139 $472 $295 Other Revenue 1 7 14 8 Total Revenue $88 $146 $485 $303 Capitated % of Total Revenue 98% 95% 97% 97% Medical Cost 92 141 486 298 MCR % Cap. Revenue 107% 102% 103% 101% MCR% Total Revenue 105% 97% 100% 98% Total Operating Expense 31 37 55 33 Opex % of Total Revenue 35% 25% 11% 11% EBITDA ($36) ($32) ($55) ($28) % Margin (41%) (22%) (11%) (9%) 56
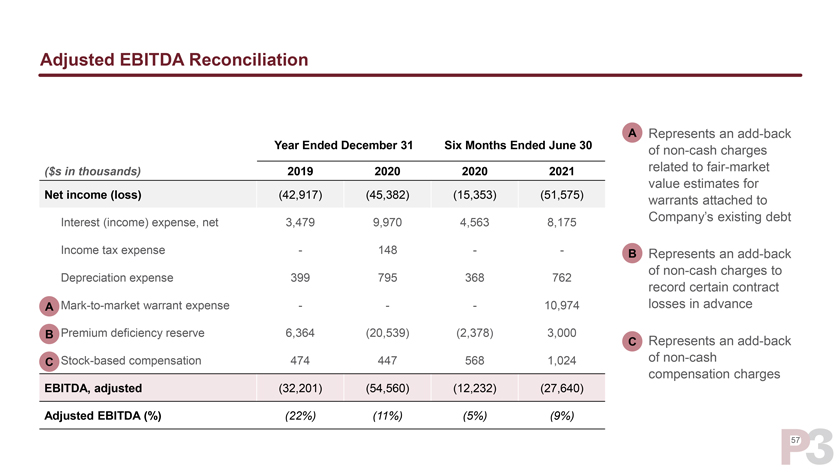
Adjusted EBITDA Reconciliation ➢ A Represents an add-back Year Ended December 31 Six Months Ended June 30 of non-cash charges ($s in thousands) 2019 2020 2020 2021 related to fair-market value estimates for Net income (loss) (42,917) (45,382) (15,353) (51,575) warrants attached to Company’s existing debt Interest (income) expense, net 3,479 9,970 4,563 8,175 Income tax expense—148 — ➢ B Represents an add-back of non-cash charges to Depreciation expense 399 795 368 762 record certain contract A Mark-to-market warrant expense ——10,974 losses in advance B Premium deficiency reserve 6,364 (20,539) (2,378) 3,000 ➢ C Represents an add-back C Stock-based compensation 474 447 568 1,024 of non-cash compensation charges EBITDA, adjusted (32,201) (54,560) (12,232) (27,640) Adjusted EBITDA (%) (22%) (11%) (5%) (9%) 57
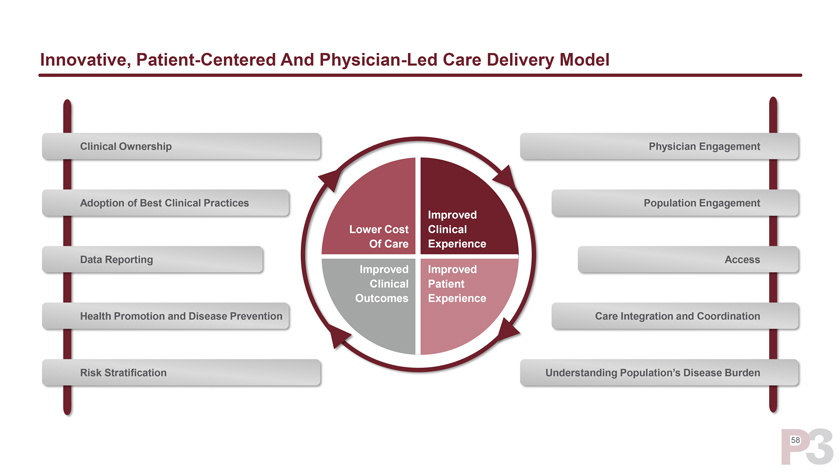
Innovative, Patient-Centered And Physician-Led Care Delivery Model Clinical Ownership Physician Engagement Adoption of Best Clinical Practices Population Engagement Improved Lower Cost Clinical Of Care Experience Data Reporting Access Improved Improved Clinical Patient Outcomes Experience Health Promotion and Disease Prevention Care Integration and Coordination Risk Stratification Understanding Population’s Disease Burden 58
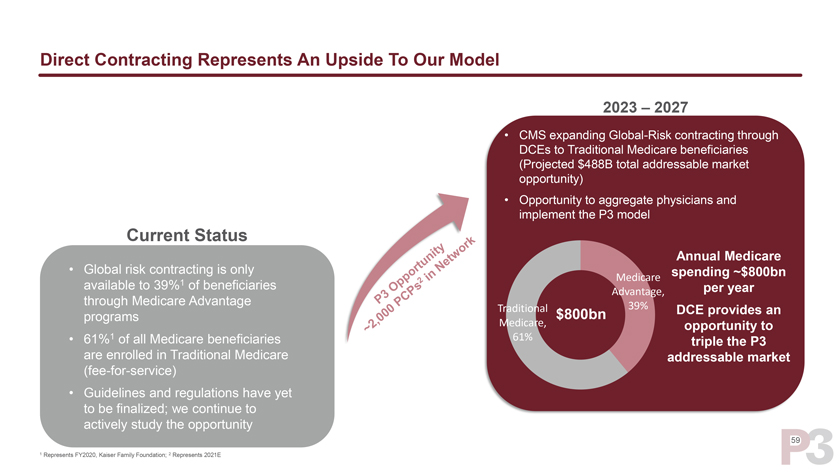
Direct Contracting Represents An Upside To Our Model 2023 – 2027 • CMS expanding Global-Risk contracting through DCEs to Traditional Medicare beneficiaries (Projected $488B total addressable market opportunity) • Opportunity to aggregate physicians and implement the P3 model Current Status Annual Medicare • Global risk contracting is only spending ~$800bn Medicare available to 39%1 of beneficiaries per year Advantage, through Medicare Advantage 39% Traditional $800bn DCE provides an programs Medicare, opportunity to • 61%1 of all Medicare beneficiaries 61% triple the P3 are enrolled in Traditional Medicare addressable market (fee-for-service) • Guidelines and regulations have yet to be finalized; we continue to actively study the opportunity 59 1 Represents FY2020, Kaiser Family Foundation; 2 Represents 2021E
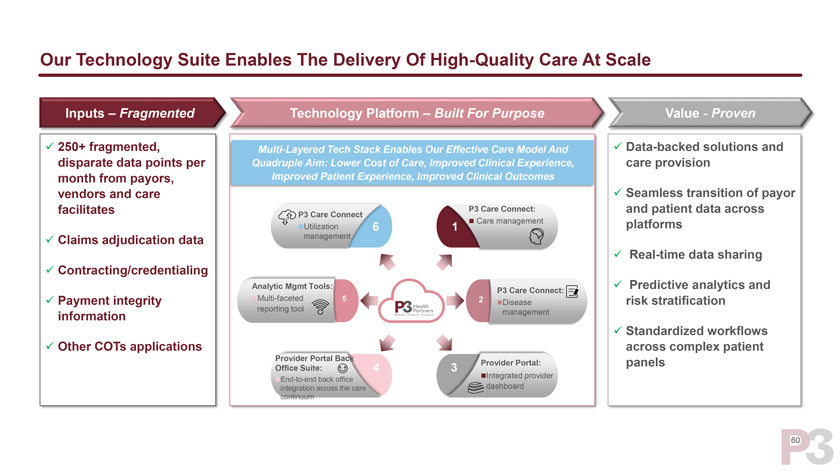
Our Technology Suite Enables The Delivery Of High-Quality Care At Scale Inputs – Fragmented Technology Platform – Built For Purpose Value—Proven ✓ 250+ fragmented, Multi-Layered Tech Stack Enables Our Effective Care Model And ✓ Data-backed solutions and disparate data points per Quadruple Aim: Lower Cost of Care, Improved Clinical Experience, care provision month from payors, Improved Patient Experience, Improved Clinical Outcomes vendors and care ✓ Seamless transition of payor facilitates P3 Care Connect: and patient data across P3 Care Connect â—¼ Care management platforms â—¼Utilization 6 1 ✓ Claims adjudication data management ✓ Real-time data sharing ✓ Contracting/credentialing Analytic Mgmt Tools: ✓ Predictive analytics and P3 Care Connect: ✓ Payment integrity â—¼Multi-faceted 5 2 risk stratification â—¼Disease reporting tool management information ✓ Standardized workflows ✓ Other COTs applications across complex patient Provider Portal Back Provider Portal: panels Office Suite: 4 3 â—¼Integrated provider â—¼End-to-end back office dashboard integration across the care continuum 60

Health partners people. Passion. Purpose.