Exhibit 99.2
P3 Investor Presentation May 2021 Who: People with Passion and Purpose What: Dedicated to Transforming Healthcare for Patients, Providers, and Payors How: Patient-Centric, Physician-Led, and Population Health Management Focused
Exhibit 99.2
P3 Investor Presentation May 2021 Who: People with Passion and Purpose What: Dedicated to Transforming Healthcare for Patients, Providers, and Payors How: Patient-Centric, Physician-Led, and Population Health Management Focused
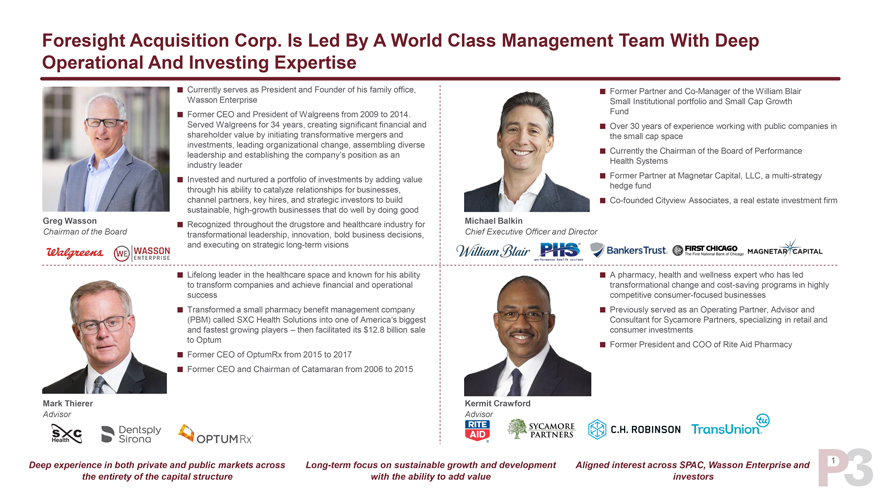
Foresight Acquisition Corp. Is Led By A World Class Management Team With Deep Operational And Investing Expertise â–Currently serves as President and Founder of his family office, â– Former Partner and Co-Manager of the William Blair Wasson Enterprise Small Institutional portfolio and Small Cap Growth â– Former CEO and President of Walgreens from 2009 to 2014. Fund Served Walgreens for 34 years, creating significant financial and â– Over 30 years of experience working with public companies in shareholder value by initiating transformative mergers and the small cap space investments, leading organizational change, assembling diverse leadership and establishing the company’s position as an â– Currently the Chairman of the Board of Performance industry leader Health Systems â– Invested and nurtured a portfolio of investments by adding value â– Former Partner at Magnetar Capital, LLC, a multi-strategy through his ability to catalyze relationships for businesses, hedge fund channel partners, key hires, and strategic investors to build â– Co-founded Cityview Associates, a real estate investment firm sustainable, high-growth businesses that do well by doing good Greg Wasson â–Recognized throughout the drugstore and healthcare industry for Michael Balkin Chairman of the Board transformational leadership, innovation, bold business decisions, Chief Executive Officer and Director and executing on strategic long-term visions â– Lifelong leader in the healthcare space and known for his ability â– A pharmacy, health and wellness expert who has led to transform companies and achieve financial and operational transformational change and cost-saving programs in highly success competitive consumer-focused businesses â– Transformed a small pharmacy benefit management company â–Previously served as an Operating Partner, Advisor and (PBM) called SXC Health Solutions into one of America’s biggest Consultant for Sycamore Partners, specializing in retail and and fastest growing players – then facilitated its $12.8 billion sale consumer investments to Optum â– Former President and COO of Rite Aid Pharmacy â– Former CEO of OptumRx from 2015 to 2017 â–Former CEO and Chairman of Catamaran from 2006 to 2015 Mark Thierer Kermit Crawford Advisor Advisor Deep experience in both private and public markets across Long-term focus on sustainable growth and development Aligned interest across SPAC, Wasson Enterprise and 1 the entirety of the capital structure with the ability to add value investors
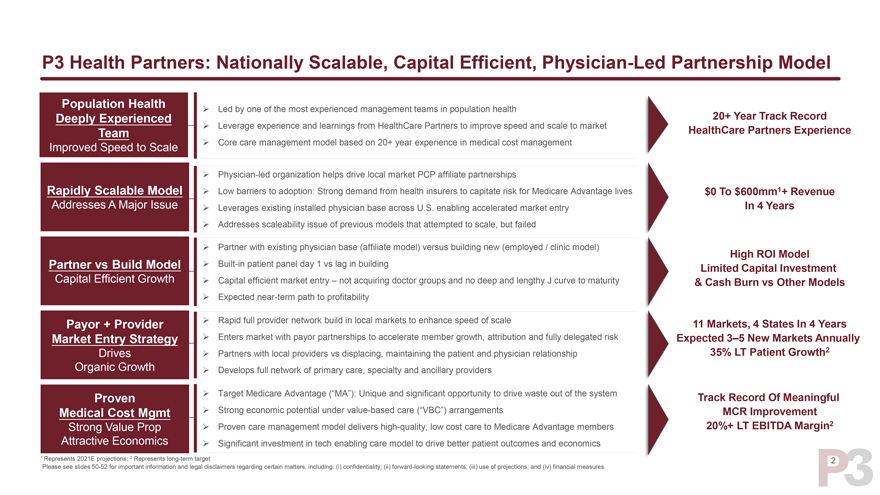
P3 Health Partners: Nationally Scalable, Capital Efficient, Physician-Led Partnership Model Population Health most management teams in population health ïƒ~ Led by one of the experienced Deeply Experienced 20+ Year Track Record Teamïƒ~ Leverage experience and learnings from HealthCare Partners to improve speed and scale to market HealthCare Partners Experience Improved Speed to Scaleïƒ~ Core care management model based on 20+ year experience in medical cost managementïƒ~ Physician-led organization helps drive local market PCP affiliate partnerships Rapidly Scalable Modelïƒ~ Low barriers to adoption: Strong demand from health insurers to capitate risk for Medicare Advantage lives $0 To $600mm1+ Revenue Addresses A Major Issueïƒ~ Leverages existing installed physician base across U.S. enabling accelerated market entry In 4 Yearsïƒ~ Addresses scaleability issue of previous models that attempted to scale, but failed ïƒ~ Partner with existing physician base (affiliate model) versus building new (employed / clinic model) Built-in High ROI Model Partner vs Build Modelïƒ~ patient panel day 1 vs lag in building Limited Capital Investment Capital Efficient Growthïƒ~ Capital efficient market entry – not acquiring doctor groups and no deep and lengthy J curve to maturity & Cash Burn vs Other Modelsïƒ~ Expected near-term path to profitability Payor + Provider ïƒ~ Rapid full provider network build in local markets to enhance speed of scale 11 Markets, 4 States In 4 Years Market Entry Strategyïƒ~ Enters market with payor partnerships to accelerate member growth, attribution and fully delegated risk Expected 3–5 New Markets Annually Drives ïƒ~ Partners with local providers vs displacing, maintaining the patient and physician relationship 35% LT Patient Growth2 Organic Growthïƒ~ Develops full network of primary care, specialty and ancillary providers Proven ïƒ~ Target Medicare Advantage (“MA”): Unique and significant opportunity to drive waste out of the system Track Record Of Meaningful Medical Cost Mgmtïƒ~ Strong economic potential under value-based care (“VBC”) arrangements MCR Improvement Strong Value Prop ïƒ~ Proven care management model delivers high-quality, low cost care to Medicare Advantage members 20%+ LT EBITDA Margin2 Attractive Economicsïƒ~ Significant investment in tech enabling care model to drive better patient outcomes and economics 1 Represents 2021E projections; 2 Represents long-term target 2 Please see slides 50-52 for important information and legal disclaimers regarding certain matters, including: (i) confidentiality; (ii) forward-looking statements; (iii) use of projections; and (iv) financial measures
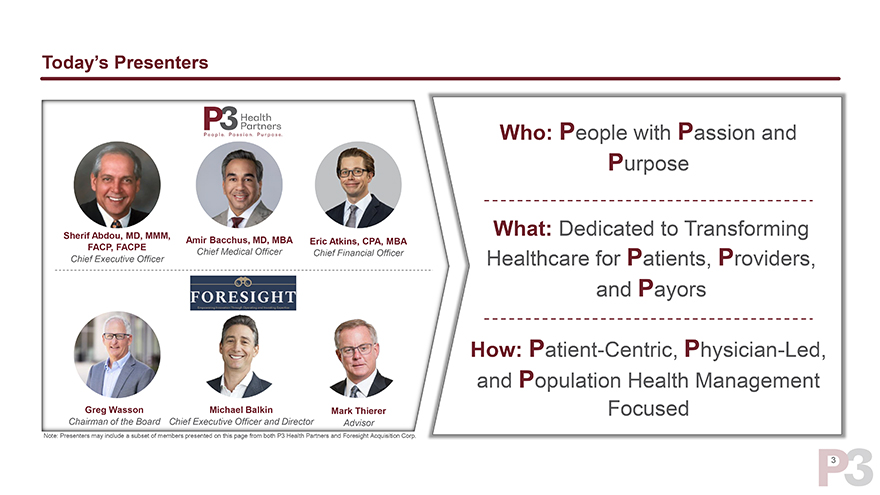
Today’s Presenters Who: People with Passion and Purpose Sherif Abdou, MD, MMM, What: Dedicated to Transforming Amir Bacchus, MD, MBA Eric Atkins, CPA, MBA FACP, FACPE Chief Medical Officer Chief Financial Officer Chief Executive Officer Healthcare for Patients, Providers, and Payors How: Patient-Centric, Physician-Led, and Population Health Management Greg Wasson Michael Balkin Mark Thierer Focused Chairman of the Board Chief Executive Officer and Director Advisor Note: Presenters may include a subset of members presented on this page from both P3 Health Partners and Foresight Acquisition Corp.
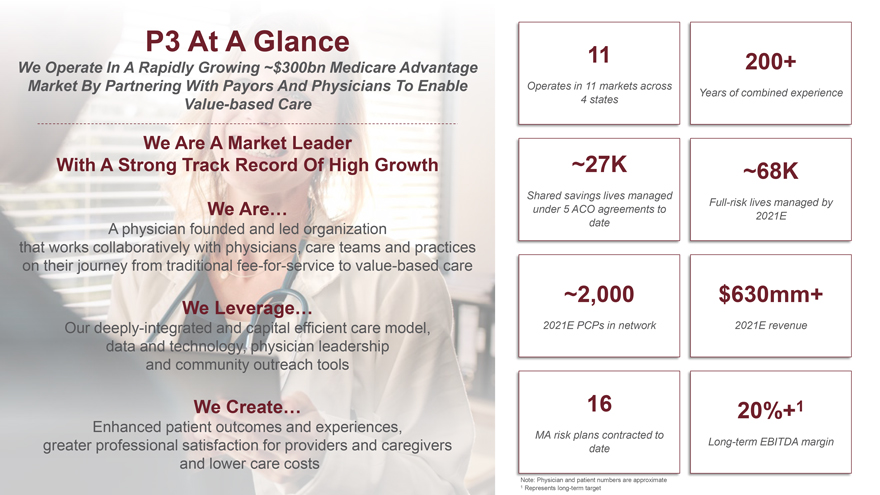
P3 At A Glance 11 We Operate In A Rapidly Growing ~$300bn Medicare Advantage 200+ Market By Partnering With Payors And Physicians To Enable Operates in 11 markets across Years of combined experience Value-based Care 4 states We Are A Market Leader With A Strong Track Record Of High Growth ~27K ~68K Shared savings lives managed Full-risk lives managed by We Are… under 5 ACO agreements to 2021E A physician founded and led organization date that works collaboratively with physicians, care teams and practices on their journey from traditional fee-for-service to value-based care ~2,000 $630mm+ We Leverage… Our deeply-integrated and capital efficient care model, 2021E PCPs in network 2021E revenue data and technology, physician leadership and community outreach tools We Create… 16 20%+1 Enhanced patient outcomes and experiences, MA risk plans contracted to greater professional satisfaction for providers and caregivers Long-term EBITDA margin date and lower care costs Note: Physician and patient numbers are approximate 1 Represents long-term target
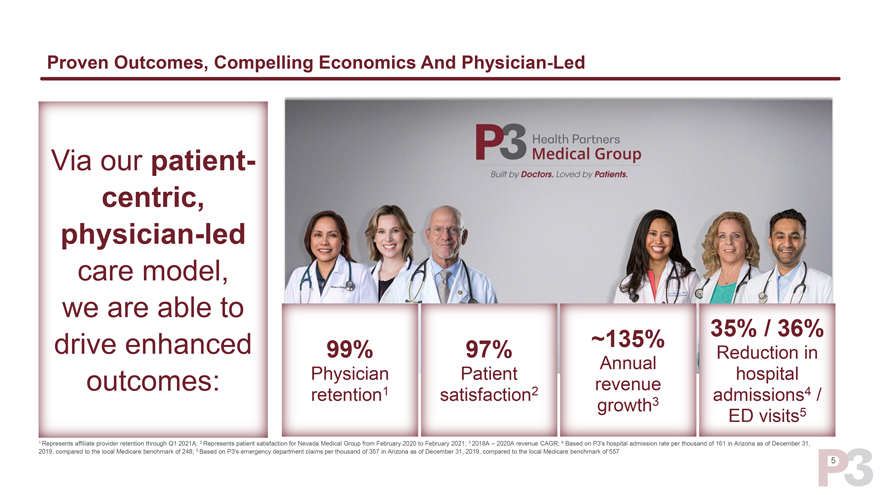
Proven Outcomes, Compelling Economics And Physician-Led Via our patient-centric, physician-led care model, we are able to drive enhanced ~135% 35% / 36% 99% 97% Reduction in Annual Physician Patient hospital outcomes: 1 2 revenue 4 retention satisfaction 3 admissions / growth 5 ED visits 1 Represents affiliate provider retention through Q1 2021A; 2 Represents patient satisfaction for Nevada Medical Group from February 2020 to February 2021; 3 2018A – 2020A revenue CAGR; 4 Based on P3’s hospital admission rate per thousand of 161 in Arizona as of December 31, 2019, compared to the local Medicare benchmark of 248; 5 Based on P3’s emergency department claims per thousand of 357 in Arizona as of December 31, 2019, compared to the local Medicare benchmark of 557 5
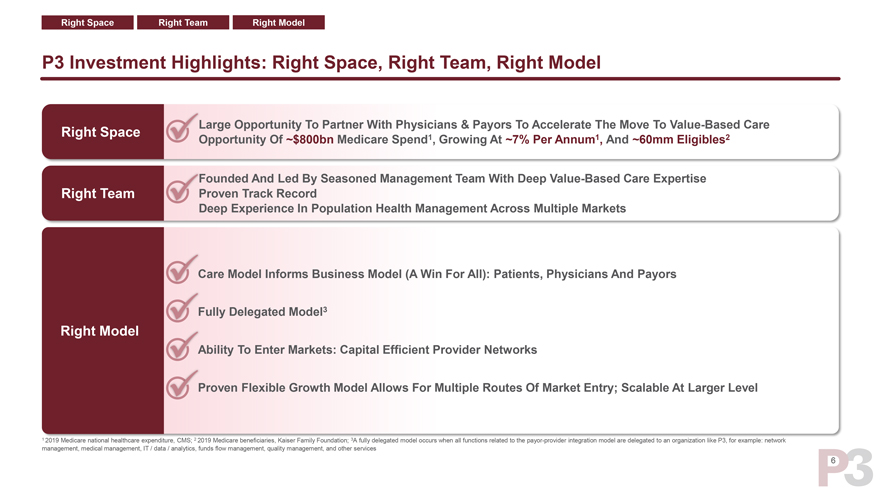
Right Space Right Team Right Model P3 Investment Highlights: Right Space, Right Team, Right Model Right Space e Opportunity To Partner With Physicians & Payors To Accelerate The Move To Value-Based Care rtunity Of ~$800bn Medicare Spend1, Growing At ~7% Per Annum1, And ~60mm Eligibles2 ded And Led By Seasoned Management Team With Deep Value-Based Care Expertise Right Team en Track Record Experience In Population Health Management Across Multiple Markets  Model Informs Business Model (A Win For All): Patients, Physicians And Payors Delegated Model3 Right Model  y To Enter Markets: Capital Efficient Provider Networks  en Flexible Growth Model Allows For Multiple Routes Of Market Entry; Scalable At Larger Level 1 2019 Medicare national healthcare expenditure, CMS; 2 2019 Medicare beneficiaries, Kaiser Family Foundation; 3A fully delegated model occurs when all functions related to the payor-provider integration model are delegated to an organization like P3, for example: network management, medical management, IT / data / analytics, funds flow management, quality management, and other services 6
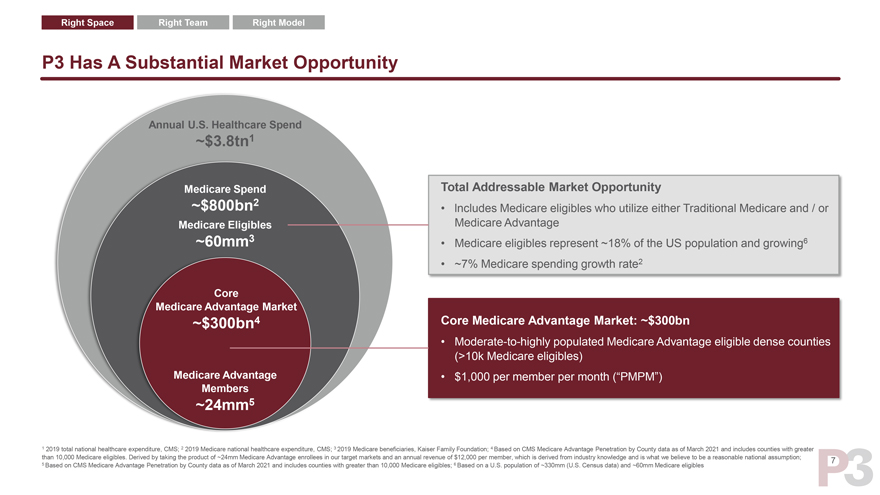
Right Space Right Team Right Model P3 Has A Substantial Market Opportunity Annual U.S. Healthcare Spend ~$3.8tn1 Medicare Spend Total Addressable Market Opportunity ~$800bn2 • lncludes Medicare eligibles who utilize either Traditional Medicare and / or Medicare Eligibles Medicare Advantage ~60mm3 • Medicare eligibles represent ~18% of the US population and growing6 • ~7% Medicare spending growth rate2 Core Medicare Advantage Market ~$300bn4 Core Medicare Advantage Market: ~$300bn • Moderate-to-highly populated Medicare Advantage eligible dense counties (>10k Medicare eligibles) Medicare Advantage • $1,000 per member per month (“PMPM”) Members ~24mm5 1 2019 total national healthcare expenditure, CMS; 2 2019 Medicare national healthcare expenditure, CMS; 3 2019 Medicare beneficiaries, Kaiser Family Foundation; 4 Based on CMS Medicare Advantage Penetration by County data as of March 2021 and includes counties with greater than 10,000 Medicare eligibles. Derived by taking the product of ~24mm Medicare Advantage enrollees in our target markets and an annual revenue of $12,000 per member, which is derived from industry knowledge and is what we believe to be a reasonable national assumption; 7 5 Based on CMS Medicare Advantage Penetration by County data as of March 2021 and includes counties with greater than 10,000 Medicare eligibles; 6 Based on a U.S. population of ~330mm (U.S. Census data) and ~60mm Medicare eligibles
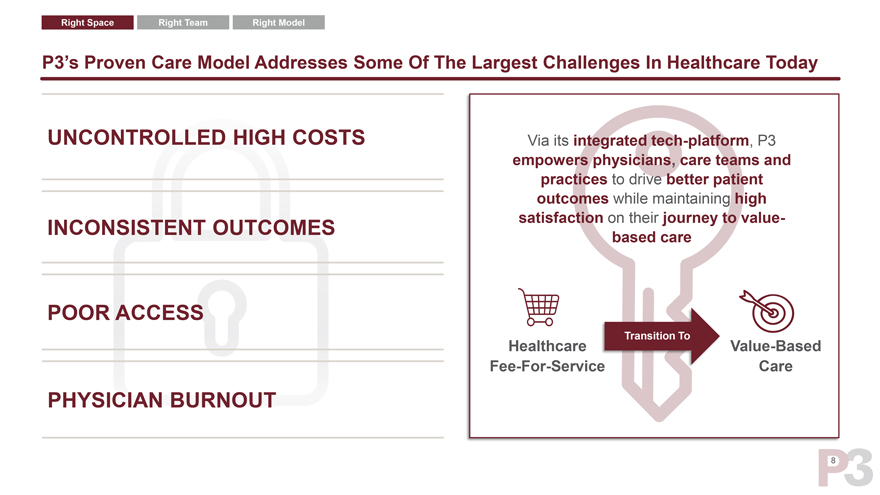
Right Space Right Team Right Model P3’s Proven Care Model Addresses Some Of The Largest Challenges In Healthcare Today UNCONTROLLED HIGH COSTS Via its integrated tech-platform, P3 empowers physicians, care teams and practices to drive better patient outcomes while maintaining high INCONSISTENT OUTCOMES satisfaction on their journey to value-based care POOR ACCESS Transition To Healthcare Value-Based Fee-For-Servic Care PHYSICIAN BURNOUT 8
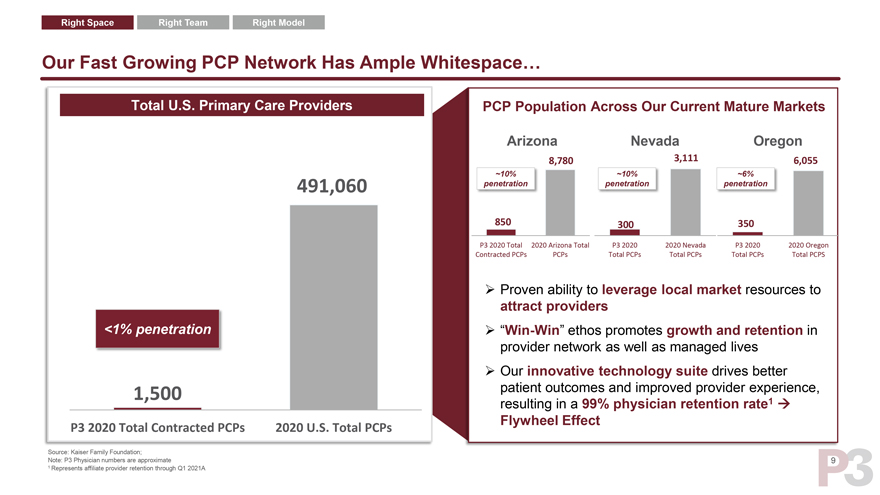
Right Space Right Team Right Model Our Fast Growing PCP Network Has Ample Whitespace… Total U.S. Primary Care Providers PCP Population Across Our Current Mature Markets Arizona Nevada Oregon 8,780 3,111 6,055 ~10% ~10% ~6% 491,060 penetration penetration penetration 850 300 350 P3 2020 Total 2020 Arizona Total P3 2020 2020 Nevada P3 2020 2020 Oregon Contracted PCPs PCPs Total PCPs Total PCPs Total PCPs Total PCPS ïƒ~ Proven ability to leverage local market resources to attract providers <1% penetrationïƒ~ “Win-Win” ethos promotes growth and retention in provider network as well as managed lives ïƒ~ Our innovative technology suite drives better 1,500 patient outcomes and improved provider experience, resulting in a 99% physician retention rate1ïƒ P3 2020 Total Contracted PCPs 2020 U.S. Total PCPs Flywheel Effect Source: Kaiser Family Foundation; Note: P3 Physician numbers are approximate 9 1 Represents affiliate provider retention through Q1 2021A
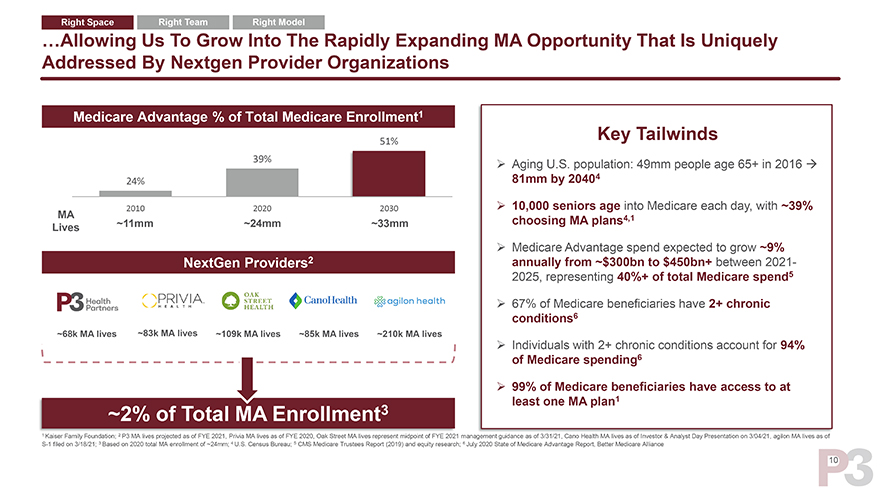
Right Space Right Team Right Model UPDATED …Allowing Us To Grow Into The Rapidly Expanding MA Opportunity That Is Uniquely Addressed By Nextgen Provider Organizations Medicare Advantage % of Total Medicare Enrollment1 Key Tailwinds 51% 39% Aging U.S. population: 49mm people age 65+ in 2016 81mm by 20404 24% 2010 2020 2030 10,000 seniors age into Medicare each day, with ~39% MA choosing MA plans4,1 Lives ~11mm ~24mm ~33mm Medicare Advantage spend expected to grow ~9% NextGen Providers2 annually from ~$300bn to $450bn+ between 2021-2025, representing 40%+ of total Medicare spend5 67% of Medicare beneficiaries have 2+ chronic conditions6 ~68k MA lives ~83k MA lives ~109k MA lives ~85k MA lives ~210k MA lives Individuals with 2+ chronic conditions account for 94% of Medicare spending6 99% of Medicare beneficiaries have access to at least one MA plan1 ~2% of Total MA Enrollment3 1 Kaiser Family Foundation; 2 P3 MA lives projected as of FYE 2021, Privia MA lives as of FYE 2020, Oak Street MA lives represent midpoint of FYE 2021 management guidance as of 3/31/21, Cano Health MA lives as of Investor & Analyst Day Presentation on 3/04/21, agilon MA lives as of S-1 filed on 3/18/21; 3 Based on 2020 total MA enrollment of ~24mm; 4 U.S. Census Bureau; 5 CMS Medicare Trustees Report (2019) and equity research; 6 July 2020 State of Medicare Advantage Report, Better Medicare Alliance
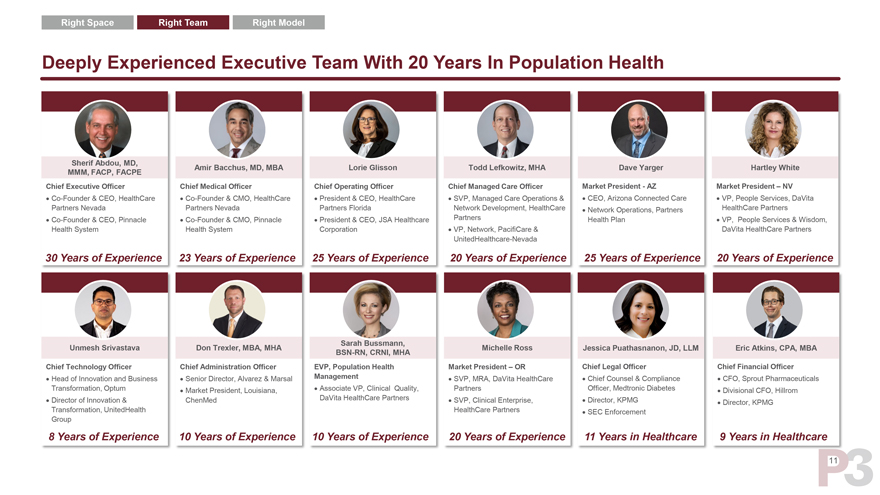
Right Space Right Team Right Model Deeply Experienced Executive Team With 20 Years In Population Health Sherif Abdou, MD, Amir Bacchus, MD, MBA Lorie Glisson Todd Lefkowitz, MHA Dave Yarger Hartley White MMM, FACP, FACPE Chief Executive Officer Chief Medical Officer Chief Operating Officer Chief Managed Care Officer Market President—AZ Market President – NV • Co-Founder & CEO, HealthCare • Co-Founder & CMO, HealthCare • President & CEO, HealthCare • SVP, Managed Care Operations & • CEO, Arizona Connected Care • VP, People Services, DaVita Partners Nevada Partners Nevada Partners Florida Network Development, HealthCare • Network Operations, Partners HealthCare Partners • Co-Founder & CEO, Pinnacle • Co-Founder & CMO, Pinnacle • President & CEO, JSA Healthcare Partners Health Plan • VP, People Services & Wisdom, Health System Health System Corporation • VP, Network, PacifiCare & DaVita HealthCare Partners UnitedHealthcare-Nevada 30 Years of Experience 23 Years of Experience 25 Years of Experience 20 Years of Experience 25 Years of Experience 20 Years of Experience Sarah Bussmann, Unmesh Srivastava Don Trexler, MBA, MHA Michelle Ross Jessica Puathasnanon, JD, LLM Eric Atkins, CPA, MBA BSN-RN, CRNI, MHA Chief Technology Officer Chief Administration Officer EVP, Population Health Market President – OR Chief Legal Officer Chief Financial Officer • Head of Innovation and Business • Senior Director, Alvarez & Marsal Management • SVP, MRA, DaVita HealthCare • Chief Counsel & Compliance • CFO, Sprout Pharmaceuticals Transformation, Optum • Market President, Louisiana, • Associate VP, Clinical Quality, Partners Officer, Medtronic Diabetes • Divisional CFO, Hillrom • Director of Innovation & ChenMed DaVita HealthCare Partners • SVP, Clinical Enterprise, • Director, KPMG Transformation, UnitedHealth HealthCare Partners • Director, KPMG Group • SEC Enforcement 8 Years of Experience 10 Years of Experience 10 Years of Experience 20 Years of Experience 11 Years in Healthcare 9 Years in Healthcare 11
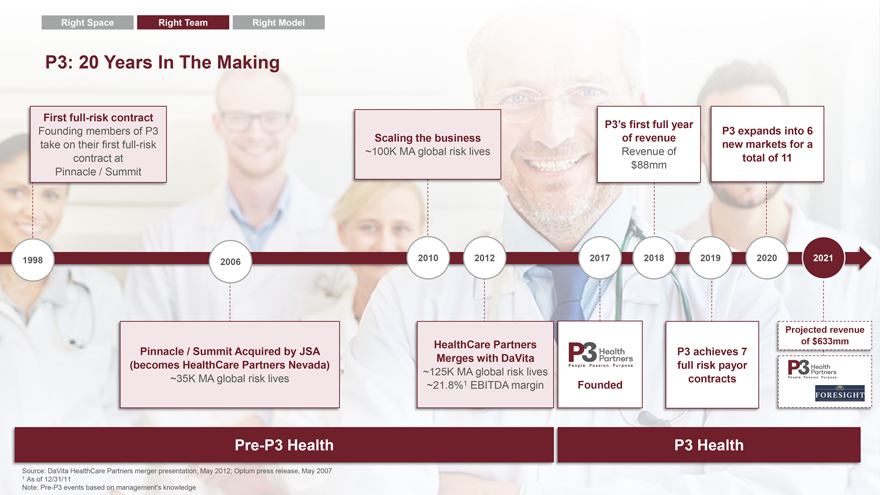
Right Space Right Team Right Model P3: 20 Years In The Making First full-risk contract P3’s first full year Founding members of P3 P3 expands into 6 Scaling the business of revenue take on their first full-risk new markets for a ~100K MA global risk lives Revenue of contract at total of 11 $88mm Pinnacle / Summit 1998 2006 2010 2012 2017 2018 2019 2020 2021 Projected revenue HealthCare Partners of $633mm Pinnacle / Summit Acquired by JSA P3 achieves 7 Merges with DaVita (becomes HealthCare Partners Nevada) full risk payor ~125K MA global risk lives ~35K MA global risk lives 1 contracts ~21.8% EBITDA margin Founded Pre-P3 Health P3 Health Source: DaVita HealthCare Partners merger presentation, May 2012; Optum press release, May 2007 1 As of 12/31/11 Note: Pre-P3 events based on management’s knowledge
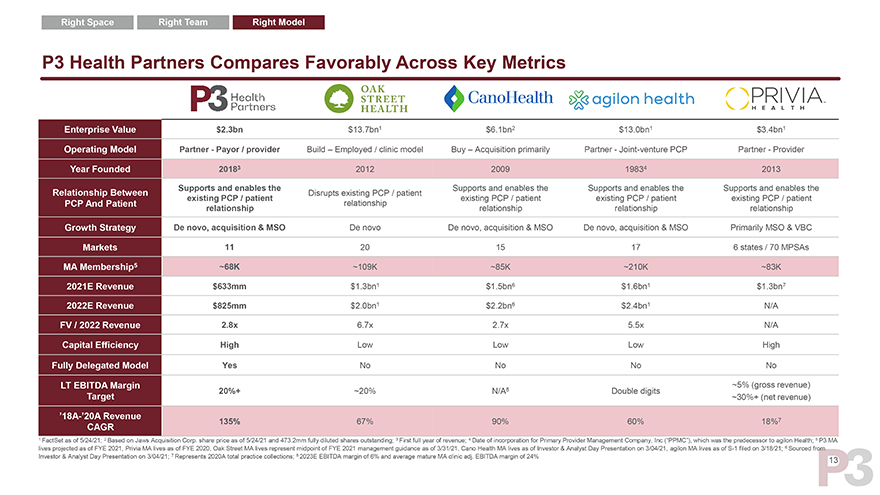
Right Space Right Team Right Model UPDATED P3 Health Partners Compares Favorably Across Key Metrics Enterprise Value $2.3bn $13.7bn1 $6.1bn2 $13.0bn1 $3.4bn1 Operating Model Partner - Payor / provider Build – Employed / clinic model Buy – Acquisition primarily Partner - Joint-venture PCP Partner - Provider Year Founded 20183 2012 2009 19834 2013 Supports and enables the Supports and enables the Supports and enables the Supports and enables the Relationship Between Disrupts existing PCP / patient existing PCP / patient existing PCP / patient existing PCP / patient existing PCP / patient PCP And Patient relationship relationship relationship relationship relationship Growth Strategy De novo, acquisition & MSO De novo De novo, acquisition & MSO De novo, acquisition & MSO Primarily MSO & VBC Markets 11 20 15 17 6 states / 70 MPSAs MA Membership5 ~68K ~109K ~85K ~210K ~83K 2021E Revenue $633mm $1.3bn1 $1.5bn6 $1.6bn1 $1.3bn7 2022E Revenue $825mm $2.0bn1 $2.2bn6 $2.4bn1 N/A FV / 2022 Revenue 2.8x 6.7x 2.7x 5.5x N/A Capital Efficiency High Low Low Low High Fully Delegated Model Yes No No No No LT EBITDA Margin ~5% (gross revenue) Target 20%+ ~20% N/A8 Double digits ~30%+ (net revenue) ‘18A-’20A Revenue CAGR 135% 67% 90% 60% 18%7 1 FactSet as of 5/24/21; 2 Based on Jaws Acquisition Corp. share price as of 5/24/21 and 473.2mm fully diluted shares outstanding; 3 First full year of revenue; 4 Date of incorporation for Primary Provider Management Company, Inc (“PPMC”), which was the predecessor to agilon Health; 5 P3 MA lives projected as of FYE 2021, Privia MA lives as of FYE 2020, Oak Street MA lives represent midpoint of FYE 2021 management guidance as of 3/31/21, Cano Health MA lives as of Investor & Analyst Day Presentation on 3/04/21, agilon MA lives as of S-1 filed on 3/18/21; 6 Sourced from 7 8
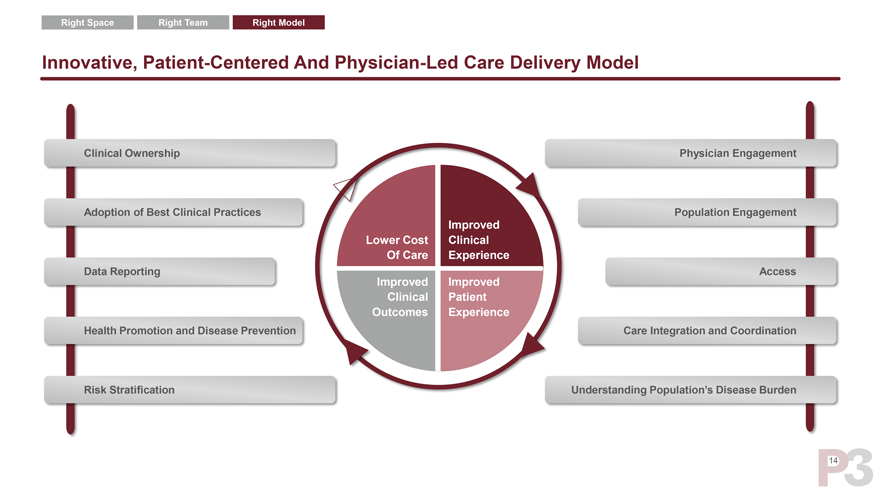
Right Space Right Team Right Model Innovative, Patient-Centered And Physician-Led Care Delivery Model Clinical Ownership Physician Engagement Adoption of Best Clinical Practices Population Engagement Improved Lower Cost Clinical Of Care Experience Data Reporting Access Improved Improved Clinical Patient Outcomes Experience Health Promotion and Disease Prevention Care Integration and Coordination Risk Stratification Understanding Population’s Disease Burden 14
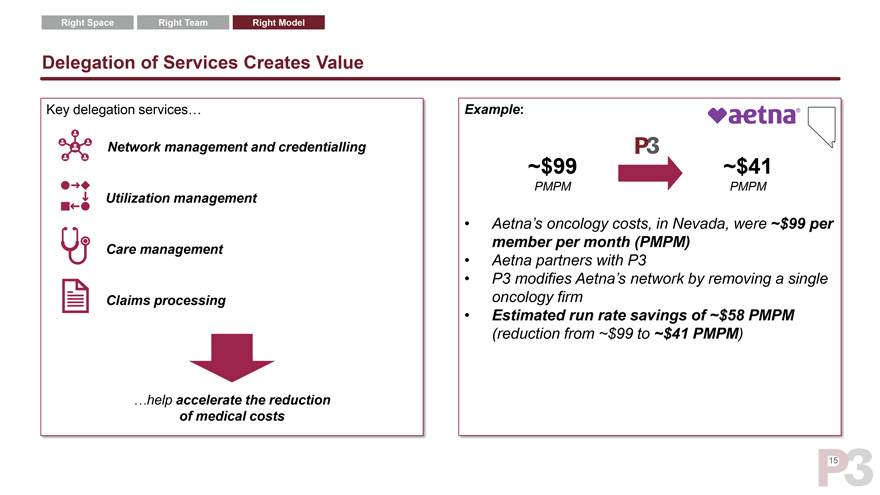
Right Space Right Team Right Model Delegation of Services Creates Value Key delegation services… Example: Network management and credentialling ~$99 ~$41 PMPM PMPM Utilization management • Aetna’s oncology costs, in Nevada, were ~$99 per member per month (PMPM) Care management • Aetna partners with P3 • P3 modifies Aetna’s network by removing a single Claims processing oncology firm • Estimated run rate savings of ~$58 PMPM (reduction from ~$99 to ~$41 PMPM) …help accelerate the reduction of medical costs 15
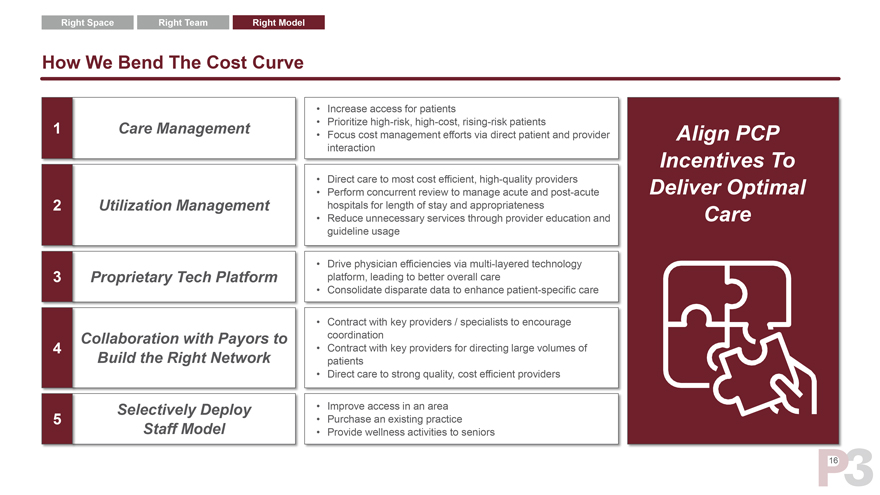
Right Space Right Team Right Model How We Bend The Cost Curve • Increase access for patients 1 Care Management • Prioritize high-risk, high-cost, rising-risk patients • Focus cost management efforts via direct patient and provider Align PCP interaction Incentives To • Direct care to most cost efficient, high-quality providers Deliver Optimal • Perform concurrent review to manage acute and post-acute 2 Utilization Management hospitals for length of stay and appropriateness Care • Reduce unnecessary services through provider education and guideline usage • Drive physician efficiencies via multi-layered technology 3 Proprietary Tech Platform platform, leading to better overall care • Consolidate disparate data to enhance patient-specific care • Contract with key providers / specialists to encourage Collaboration with Payors to coordination 4 • Contract with key providers for directing large volumes of Build the Right Network patients • Direct care to strong quality, cost efficient providers Selectively Deploy • Improve access in an area 5 • Purchase an existing practice Staff Model • Provide wellness activities to seniors 16
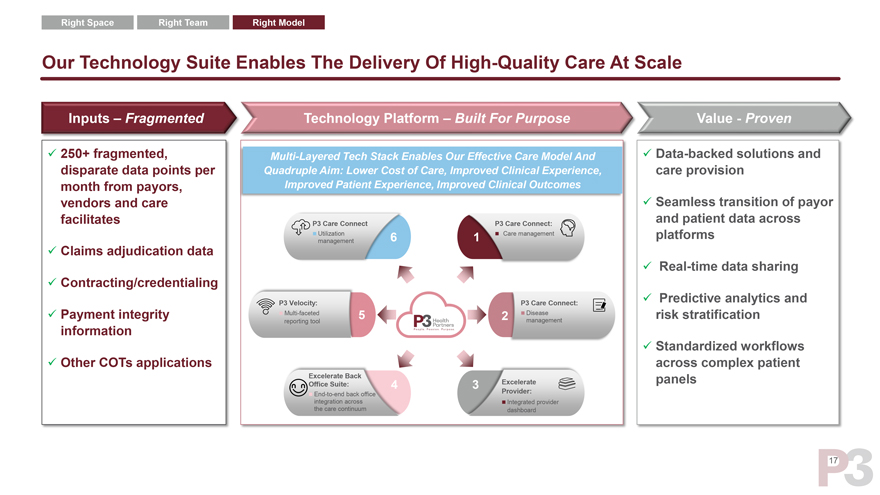
Right Space Right Team Right Model Our Technology Suite Enables The Delivery Of High-Quality Care At Scale Inputs – Fragmented Technology Platform – Built For Purpose Value—Proven  250+ fragmented, Multi-Layered Tech Stack Enables Our Effective Care Model And  Data-backed solutions and disparate data points per Quadruple Aim: Lower Cost of Care, Improved Clinical Experience, care provision month from payors, Improved Patient Experience, Improved Clinical Outcomes vendors and care  Seamless transition of payor facilitates P3 Care Connect P3 Care Connect: and patient data across ï®Utilization 6 1ï® Care management platforms management  Claims adjudication data  Real-time data sharing  Contracting/credentialing P3 Velocity: P3 Care Connect:  Predictive analytics and  Payment integrity ï®Multi-faceted 5 2ï®Disease risk stratification reporting tool management information  Standardized workflows  Other COTs applications across complex patient Excelerate Back panels Office Suite: 4 3 Excelerate back Provider: ï®End-to-end office integration acrossï®Integrated provider the care continuum dashboard 17
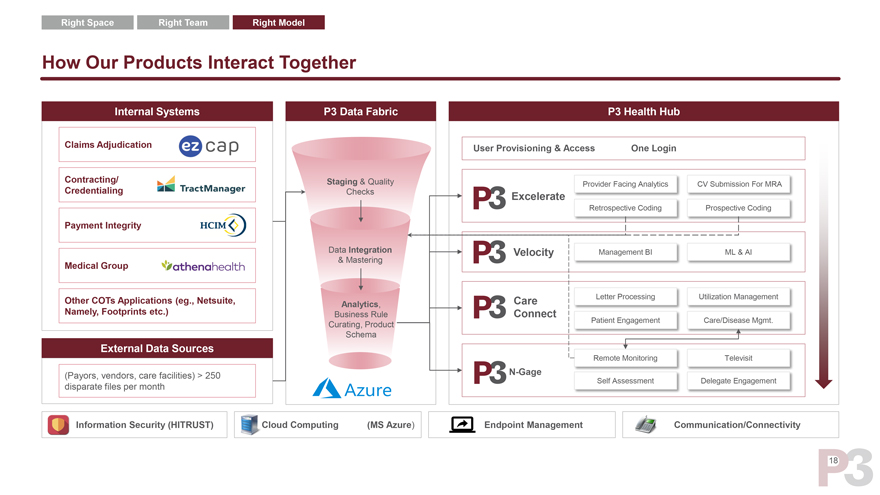
Right Space Right Team Right Model How Our Products Interact Together Internal Systems P3 Data Fabric P3 Health Hub Claims Adjudication User Provisioning & Access One Login Contracting/ Staging & Quality Provider Facing Analytics CV Submission For MRA Credentialing Checks Excelerate Retrospective Coding Prospective Coding Payment Integrity Data Integration Velocity Management BI ML & AI & Mastering Medical Group Other COTs Applications (eg., Netsuite, Care Letter Processing Utilization Management Analytics, Namely, Footprints etc.) Business Rule Connect Patient Engagement Care/Disease Mgmt. Curating, Product Schema External Data Sources Remote Monitoring Televisit (Payors, vendors, care facilities) > 250 N-Gage Self Assessment Delegate Engagement disparate files per month Information Security (HITRUST) Cloud Computing (MS Azure) Endpoint Management Communication/Connectivity 18
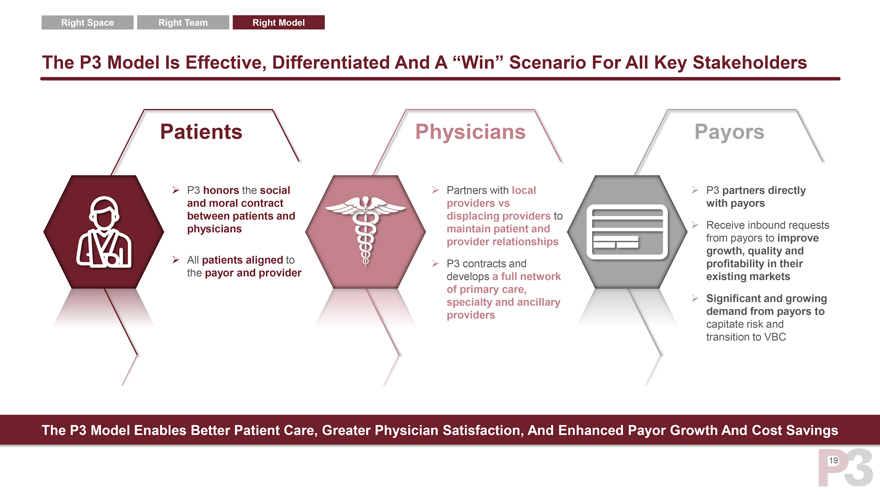
Right Space Right Team Right Model The P3 Model Is Effective, Differentiated And A “Win” Scenario For All Key Stakeholders The P3 Model Enables Better Patient Care, Greater Physician Satisfaction, And Enhanced Payor Growth And Cost Savings 19
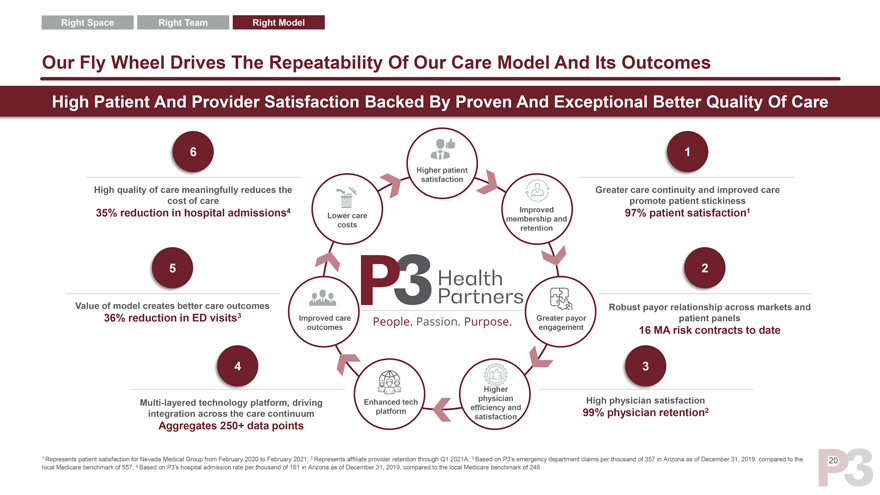
Right Space Right Team Right Model Our Fly Wheel Drives The Repeatability Of Our Care Model And Its Outcomes High Patient And Provider Satisfaction Backed By Proven And Exceptional Better Quality Of Care 6 1 Higher patient satisfaction High quality of care meaningfully reduces the Greater care continuity and improved care cost of care promote patient stickiness 35% reduction in hospital admissions4 Improved 97% patient satisfaction1 Lower care membership and costs retention 5 2 Value of model creates better care outcomes Robust payor relationship across markets and 36% reduction in ED visits3 Improved care Greater payor patient panels outcomes engagement 16 MA risk contracts to date 4 3 Higher Multi-layered technology platform, driving Enhanced tech physician High physician satisfaction platform efficiency and 99% physician retention2 integration across the care continuum satisfaction Aggregates 250+ data points 1 Represents patient satisfaction for Nevada Medical Group from February 2020 and of 357 in Arizona as of December 31, 2019, compared to the 20 local Medicare benchmark of 557; 4 Based on P3’s hospital admission rate per
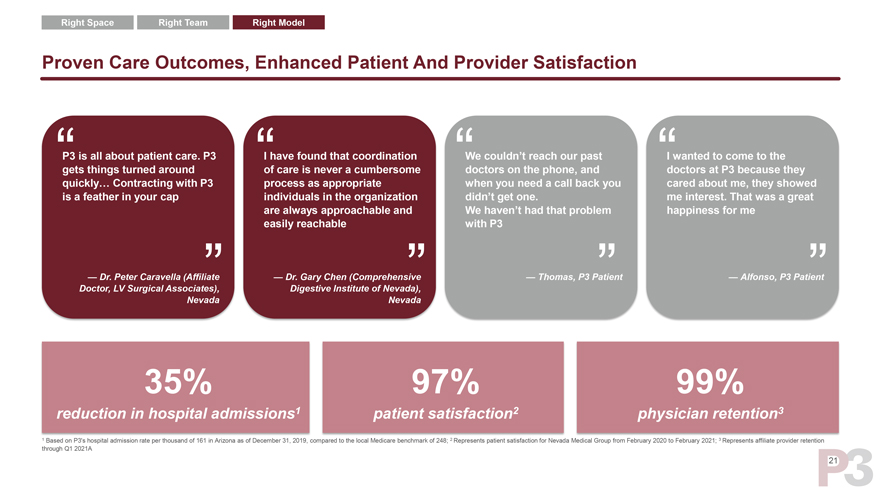
Right Space Right Team Right Model Proven Care Outcomes, Enhanced Patient And Provider Satisfaction “P3 is all about patient care. P3 “I have found that coordination “We couldn’t reach our past “I wanted to come to the gets things turned around of care is never a cumbersome doctors on the phone, and doctors at P3 because they quickly… Contracting with P3 process as appropriate when you need a call back you cared about me, they showed is a feather in your cap individuals in the organization didn’t get one. me interest. That was a great are always approachable and We haven’t had that problem happiness for me “ easily reachable “ with P3 “ “ — Dr. Peter Caravella (Affiliate — Dr. Gary Chen (Comprehensive — Thomas, P3 Patient — Alfonso, P3 Patient Doctor, LV Surgical Associates), Digestive Institute of Nevada), Nevada Nevada 35% 97% 99% reduction in hospital admissions1 patient satisfaction2 physician retention3 1 Based on P3’s hospital admission rate per thousand of 161 in Arizona as of December 31, 2019, compared to the local Medicare benchmark of 248; 2 Represents patient satisfaction for Nevada Medical Group from February 2020 to February 2021; 3 Represents affiliate provider retention through Q1 2021A 21
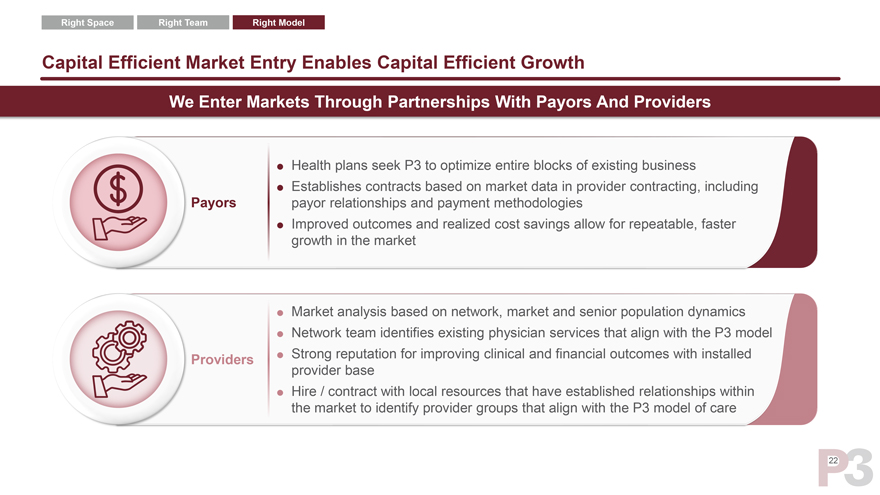
Right Space Right Team Right Model Capital Efficient Market Entry Enables Capital Efficient Growth We Enter Markets Through Partnerships With Payors And Providers  Health plans seek P3 to optimize entire blocks of existing business  Establishes contracts based on market data in provider contracting, including Payors payor relationships and payment methodologies Improved outcomes and realized cost savings allow for repeatable, faster growth in the market  Market analysis based on network, market and senior population dynamics  Network team identifies existing physician services that align with the P3 model Providers Strong reputation for improving clinical and financial outcomes with installed provider base Hire / contract with local resources that have established relationships within the market to identify provider groups that align with the P3 model of care 22
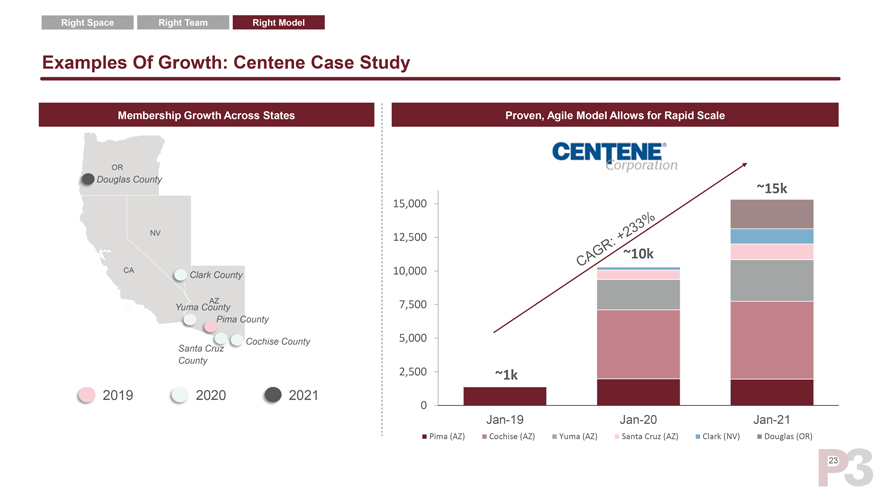
Right Space Right Team Right Model Examples Of Growth: Centene Case Study Membership Growth Across States Proven, Agile Model Allows for Rapid Scale OR Douglas County ~15k 15,000 NV 12,500 ~10k CA Clark County 10,000 AZ 7,500 Yuma County Pima County Cochise County 5,000 Santa Cruz County 2,500 ~1k 2019 2020 2021 0 Jan-19 Jan-20 Jan-21 Pima (AZ) Cochise (AZ) Yuma (AZ) Santa Cruz (AZ) Clark (NV) Douglas (OR) 23
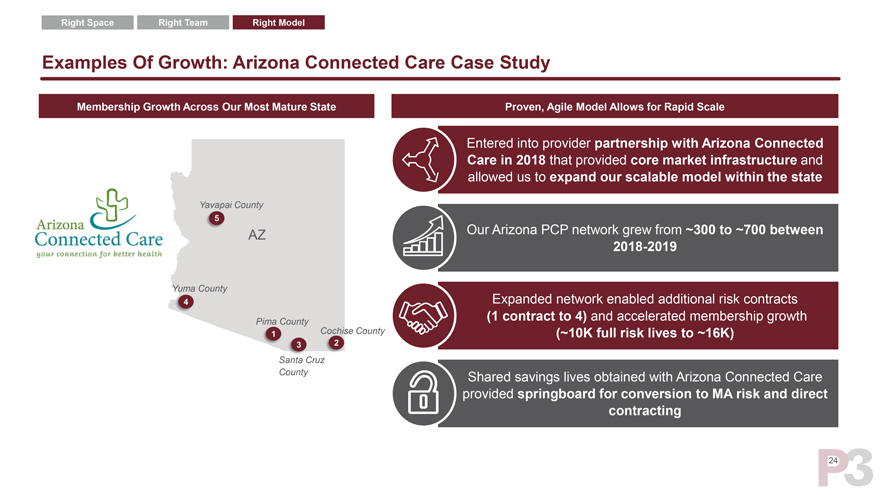
Right Space Right Team Right Model Examples Of Growth: Arizona Connected Care Case Study Membership Growth Across Our Most Mature State Proven, Agile Model Allows for Rapid Scale Entered into provider partnership with Arizona Connected Care in 2018 that provided core market infrastructure and allowed us to expand our scalable model within the state Yavapai County 5 AZ Our Arizona PCP network grew from ~300 to ~700 between 2018-2019 Yuma County 4 Expanded network enabled additional risk contracts Pima County (1 contract to 4) and accelerated membership growth 1 Cochise County (~10K full risk lives to ~16K) 3 2 Santa Cruz County Shared savings lives obtained with Arizona Connected Care provided springboard for conversion to MA risk and direct contracting 24
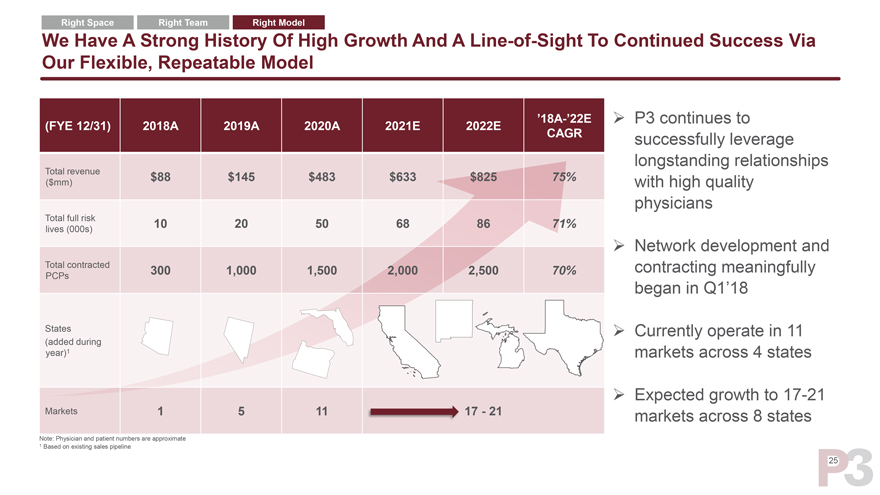
Right Space Right Team Right Model We Have A Strong History Of High Growth And A Line-of-Sight To Continued Success Via Our Flexible, Repeatable Model ’18A-’22E ïƒ~ P3 continues to (FYE 12/31) 2018A 2019A 2020A 2021E 2022E CAGR successfully leverage longstanding relationships Total revenue $88 $145 $483 $633 $825 75% ($mm) with high quality physicians Total full risk 10 20 50 68 86 71% lives (000s) ïƒ~ Network development and Total contracted 300 1,000 1,500 2,000 2,500 70% contracting meaningfully PCPs began in Q1’18 States ïƒ~ Currently operate in 11 (added during year)1 markets across 4 states ïƒ~ Expected growth to 17-21 Markets 1 5 11 17—21 markets across 8 states Note: Physician and patient numbers are approximate 1 Based on existing sales pipeline 25
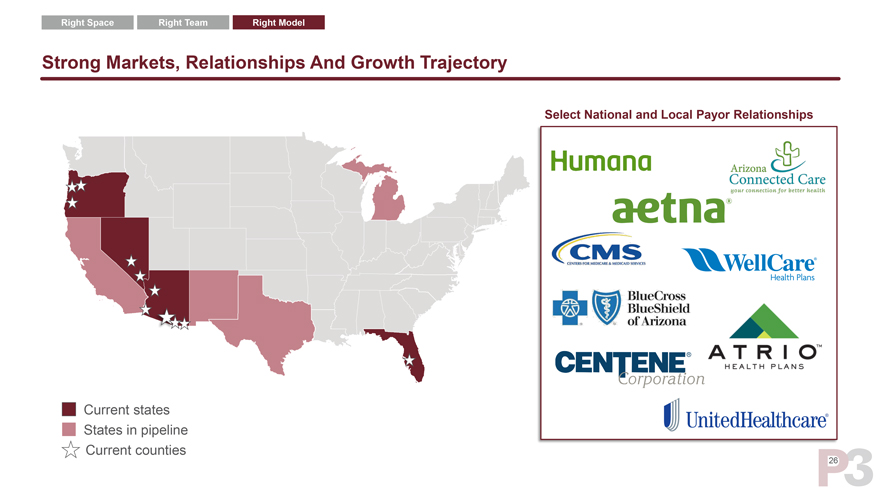
Right Space Right Team Right Model Strong Markets, Relationships And Growth Trajectory Select National and Local Payor Relationships Current states States in pipeline Current counties 26
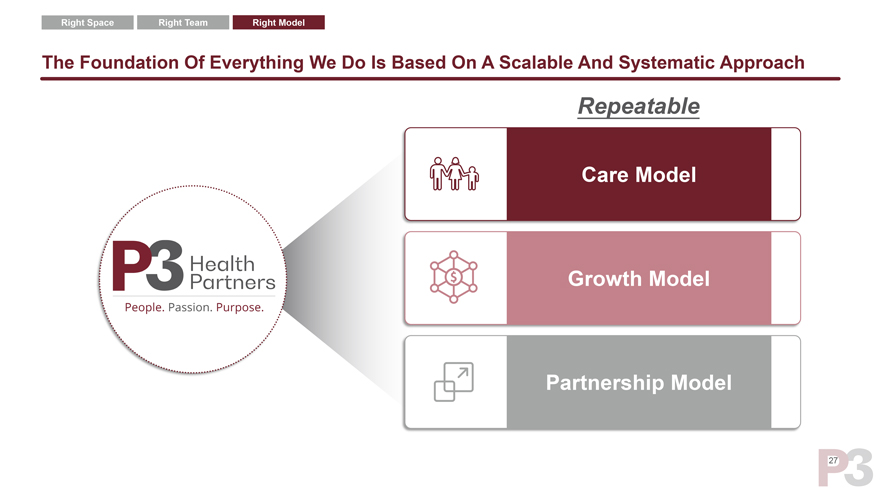
Right Space Right Team Right Model The Foundation Of Everything We Do Is Based On A Scalable And Systematic Approach Repeatable Care Model Growth Model Partnership Model 27
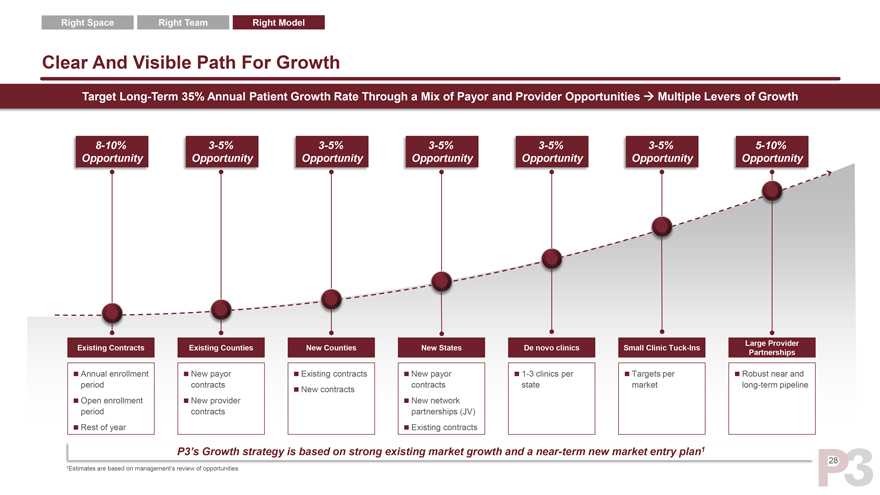
Right Space Right Team Right Model Clear And Visible Path For Growth Target Long-Term 35% Annual Patient Growth Rate Through a Mix of Payor and Provider Opportunities ïƒ Multiple Levers of Growth 8-10% 3-5% 3-5% 3-5% 3-5% 3-5% 5-10% Opportunity Opportunity Opportunity Opportunity Opportunity Opportunity Opportunity Large Provider Existing Contracts Existing Counties New Counties New States De novo clinics Small Clinic Tuck-Ins Partnerships ï® Annual enrollment ï® New payor ï® Existing contractsï® New payor ï® 1-3 clinics per ï® Targets per ï® Robust near and period contracts contracts state market long-term pipelineï® New contractsï® Open enrollment ï® New provider ï® New network period contracts partnerships (JV)ï® Rest of yearï® Existing contracts P3’s Growth strategy is based on strong existing market growth and a near-term new market entry plan1 28 1Estimates are based on management’s review of opportunities
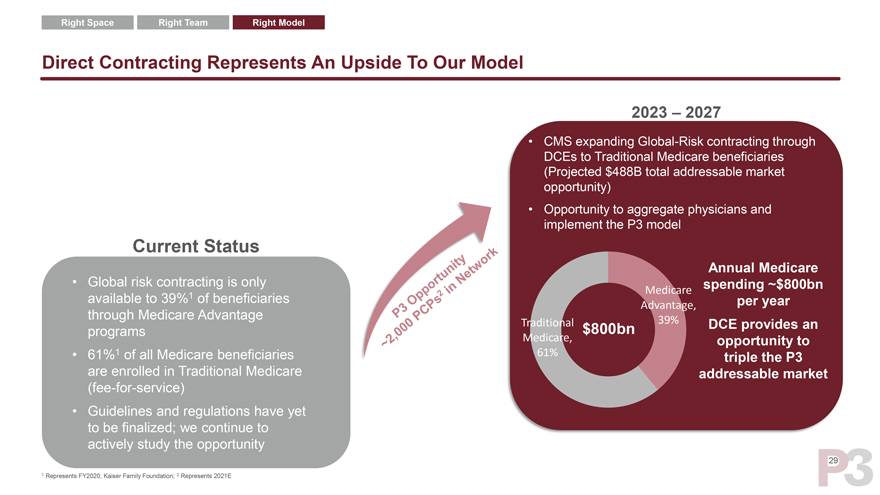
Right Space Right Team Right Model Direct Contracting Represents An Upside To Our Model 2023 – 2027 • CMS expanding Global-Risk contracting through DCEs to Traditional Medicare beneficiaries (Projected $488B total addressable market opportunity) • Opportunity to aggregate physicians and implement the P3 model Current Status • Global risk contracting is only Annual Medicare available to 39%1 of beneficiaries Medicare spending ~$800bn through Medicare Advantage Advantage, per year Traditional 39% DCE provides an programs $800bn Medicare, opportunity to • 61%1 of all Medicare beneficiaries 61% triple the P3 are enrolled in Traditional Medicare addressable market (fee-for-service) • Guidelines and regulations have yet to be finalized; we continue to actively study the opportunity 29 1 Represents FY2020, Kaiser Family Foundation; 2 Represents 2021E
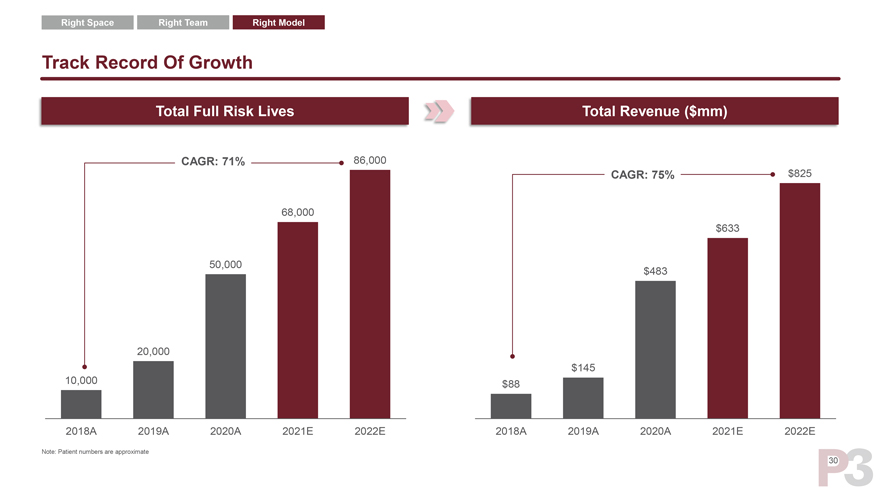
Right Space Right Team Right Model Track Record Of Growth Total Full Risk Lives Total Revenue ($mm) CAGR: 71% 86,000 CAGR: 75% $825 68,000 $633 50,000 $483 20,000 $145 10,000 $88 2018A 2019A 2020A 2021E 2022E 2018A 2019A 2020A 2021E 2022E Note: Patient numbers are approximate 30
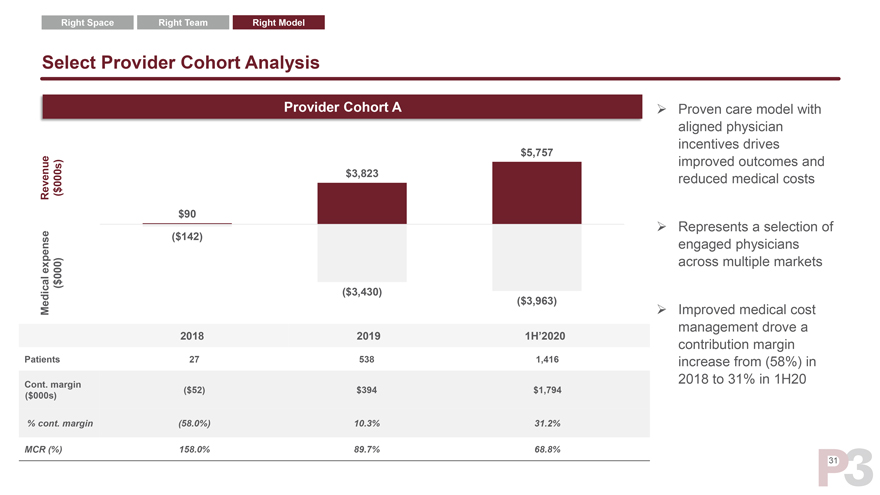
Right Space Right Team Right Model Select Provider Cohort Analysis Provider Cohort Aïƒ~ Proven care model with aligned physician incentives drives $5,757 improved outcomes and 000s) $3,823 reduced medical costs Revenue( $ $90 ïƒ~ Represents a selection of ($142) engaged physicians expense across multiple markets 000) ( $ ($3,430) ($3,963) Medicalïƒ~ Improved medical cost management drove a 2018 2019 1H’2020 contribution margin Patients 27 538 1,416 increase from (58%) in Cont. margin ($52) $394 $1,794 2018 to 31% in 1H20 ($000s) % cont. margin (58.0%) 10.3% 31.2% MCR (%) 158.0% 89.7% 68.8% 31
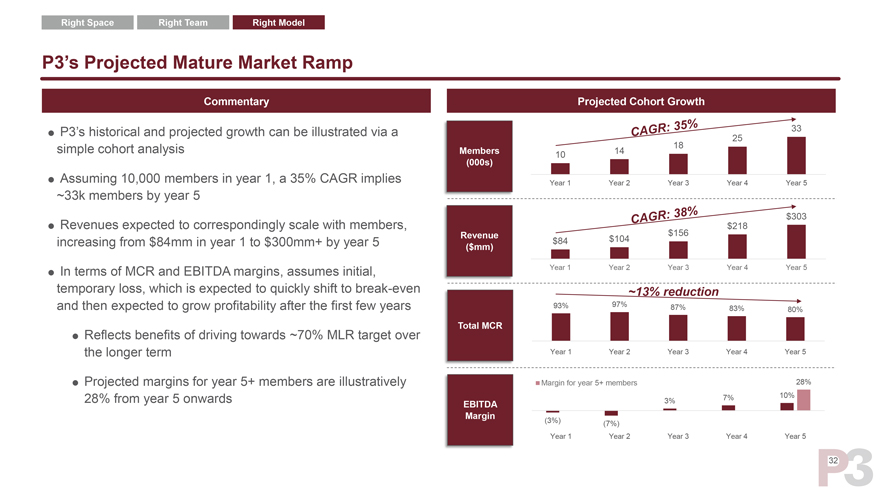
Right Space Right Team Right Model P3’s Projected Mature Market Ramp Commentary Projected Cohort Growth be via 33  P3’s historical and projected growth can illustrated a 25 simple cohort analysis 18 Members 10 14 (000s)  Assuming 10,000 members in year 1, a 35% CAGR implies Year 1 Year 2 Year 3 Year 4 Year 5 ~33k members by year 5 $218 $303  Revenues expected to correspondingly scale with members, Revenue $156 increasing from $84mm in year 1 to $300mm+ by year 5 $84 $104 ($mm) Year 1 Year 2 Year 3 Year 4 Year 5  In terms of MCR and EBITDA margins, assumes initial, temporary loss, which is expected to quickly shift to break-even ~13% reduction and then expected to grow profitability after the first few years 93% 97% 87% 83% 80% Total MCR  Reflects benefits of driving towards ~70% MLR target over the longer term Year 1 Year 2 Year 3 Year 4 Year 5  Projected margins for year 5+ members are illustratively Margin for year 5+ members 28% 28% from year 5 onwards 7% 10% EBITDA 3% Margin (3%) (7%) Year 1 Year 2 Year 3 Year 4 Year 5 32
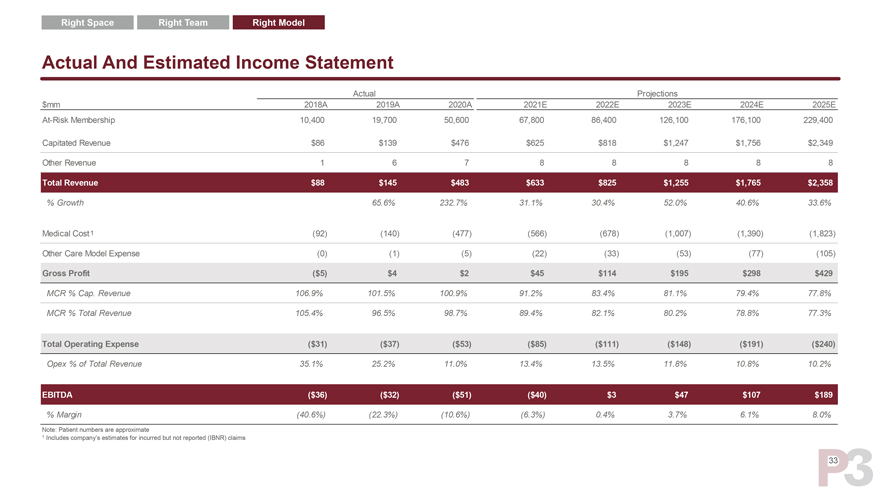
Right Space Right Team Right Model Actual And Estimated Income Statement Actual Projections $mm 2018A 2019A 2020A 2021E 2022E 2023E 2024E 2025E At-Risk Membership 10,400 19,700 50,600 67,800 86,400 126,100 176,100 229,400 Capitated Revenue $86 $139 $476 $625 $818 $1,247 $1,756 $2,349 Other Revenue 1 6 7 8 8 8 8 8 Total Revenue $88 $145 $483 $633 $825 $1,255 $1,765 $2,358 % Growth 65.6% 232.7% 31.1% 30.4% 52.0% 40.6% 33.6% Medical Cost1 (92) (140) (477) (566) (678) (1,007) (1,390) (1,823) Other Care Model Expense (0) (1) (5) (22) (33) (53) (77) (105) Gross Profit ($5) $4 $2 $45 $114 $195 $298 $429 MCR % Cap. Revenue 106.9% 101.5% 100.9% 91.2% 83.4% 81.1% 79.4% 77.8% MCR % Total Revenue 105.4% 96.5% 98.7% 89.4% 82.1% 80.2% 78.8% 77.3% Total Operating Expense ($31) ($37) ($53) ($85) ($111) ($148) ($191) ($240) Opex % of Total Revenue 35.1% 25.2% 11.0% 13.4% 13.5% 11.8% 10.8% 10.2% EBITDA ($36) ($32) ($51) ($40) $3 $47 $107 $189 % Margin (40.6%) (22.3%) (10.6%) (6.3%) 0.4% 3.7% 6.1% 8.0% Note: Patient numbers are approximate 1 Includes company’s estimates for incurred but not reported (IBNR) claims 33
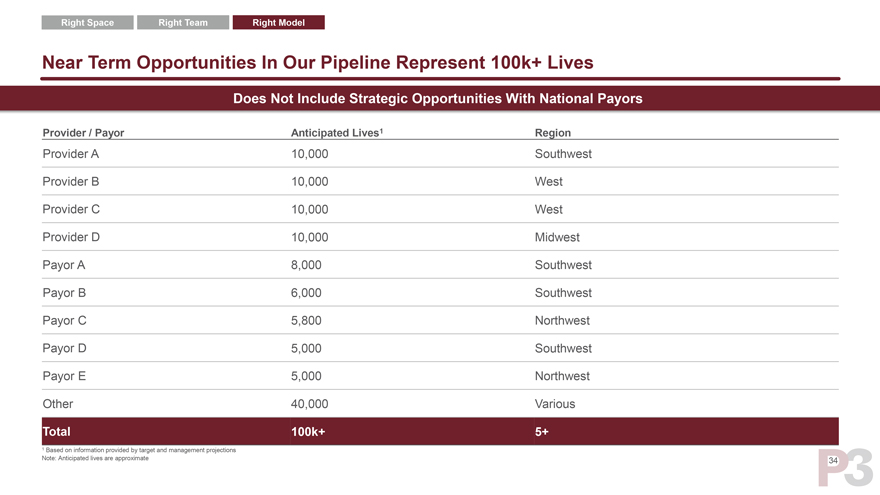
Right Space Right Team Right Model Near Term Opportunities In Our Pipeline Represent 100k+ Lives Does Not Include Strategic Opportunities With National Payors Provider / Payor Anticipated Lives1 Region Provider A 10,000 Southwest Provider B 10,000 West Provider C 10,000 West Provider D 10,000 Midwest Payor A 8,000 Southwest Payor B 6,000 Southwest Payor C 5,800 Northwest Payor D 5,000 Southwest Payor E 5,000 Northwest Other 40,000 Various Total 100k+ 5+ 1 Based on information provided by target and management projections Note: Anticipated lives are approximate 34
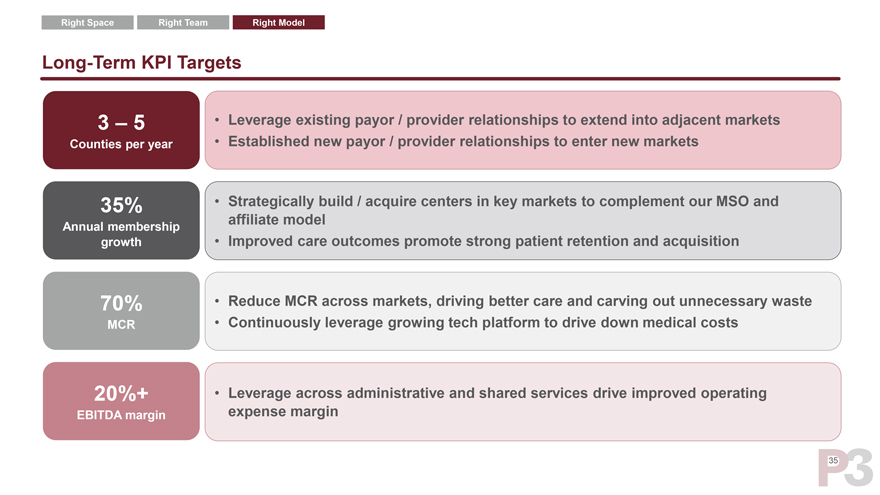
Right Space Right Team Right Model Long-Term KPI Targets 3 – 5 • Leverage existing payor / provider relationships to extend into adjacent markets Counties per year • Established new payor / provider relationships to enter new markets 35% • Strategically build / acquire centers in key markets to complement our MSO and Annual membership affiliate model growth • Improved care outcomes promote strong patient retention and acquisition 70% • Reduce MCR across markets, driving better care and carving out unnecessary waste MCR • Continuously leverage growing tech platform to drive down medical costs 20%+ • Leverage across administrative and shared services drive improved operating EBITDA margin expense margin 35
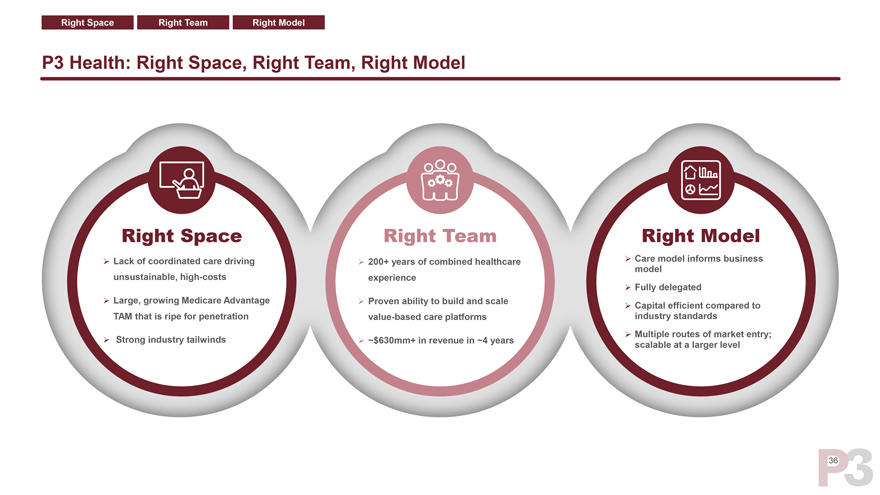
Right Space Right Team Right Model P3 Health: Right Space, Right Team, Right Model Right Space Right Team Right Model ïƒ~ Lack of coordinated care driving ïƒ~ 200+ years of combined healthcare ïƒ~ Care model informs business model unsustainable, high-costs experience ïƒ~ Fully delegatedïƒ~ Large, growing Medicare Advantage ïƒ~ Proven ability to build and scale ïƒ~ Capital efficient compared to TAM that is ripe for penetration value-based care platforms industry standardsïƒ~ Multiple routes of market entry; ïƒ~ Strong industry tailwinds ïƒ~ ~$630mm+ in revenue in ~4 years scalable at a larger level 36
Transaction Overview
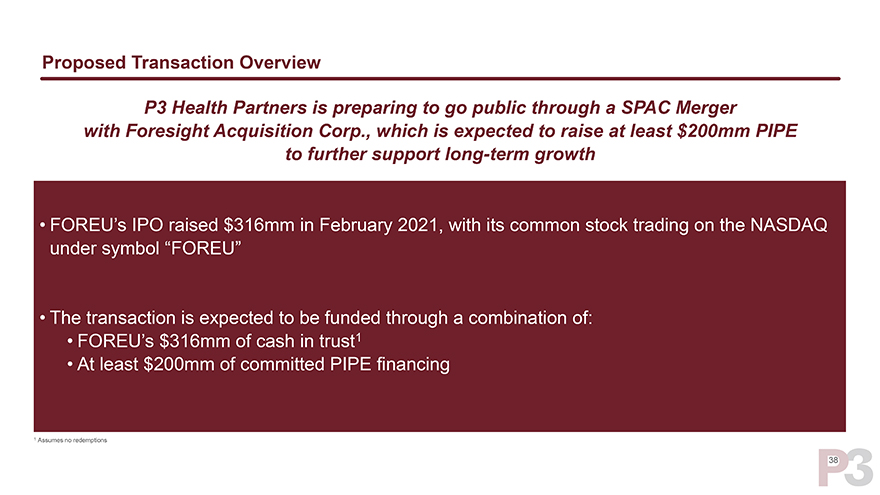
Proposed Transaction Overview P3 Health Partners is preparing to go public through a SPAC Merger with Foresight Acquisition Corp., which is expected to raise at least $200mm PIPE to further support long-term growth •FOREU’s IPO raised $316mm in February 2021, with its common stock trading on the NASDAQ under symbol “FOREU” •The transaction is expected to be funded through a combination of: •FOREU’s $316mm of cash in trust1 •At least $200mm of committed PIPE financing 1 Assumes no redemptions
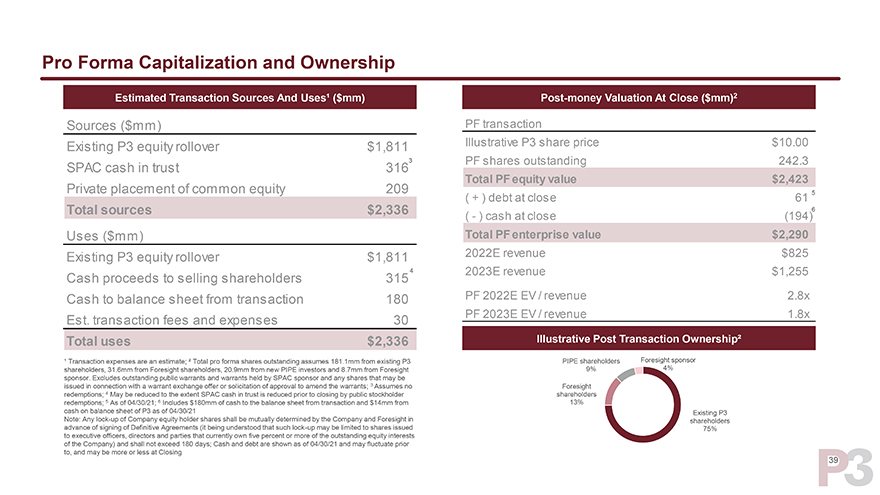
Pro Forma Capitalization and Ownership Estimated Transaction Sources And Uses¹ ($mm) Post-money Valuation At Close ($mm)2 Sources ($mm) PF transaction Existing P3 equity rollover $1,811 Illustrative P3 share price $10.00 3 PF shares outstanding 242.3 SPAC cash in trust 316 Total PF equity value $2,423 Private placement of common equity 209 5 ( + ) debt at close 61 Total sources $2,336 6 ( - ) cash at close (194) Uses ($mm) Total PF enterprise value $2,290 Existing P3 equity rollover $1,811 2022E revenue $825 4 2023E revenue $1,255 Cash proceeds to selling shareholders 315 Cash to balance sheet from transaction 180 PF 2022E EV / revenue 2.8x Est. transaction fees and expenses 30 PF 2023E EV / revenue 1.8x Total uses $2,336 Illustrative Post Transaction Ownership² ¹ Transaction expenses are an estimate; ² Total pro forma shares outstanding assumes 181.1mm from existing P3 PIPE shareholders Foresight sponsor shareholders, 31.6mm from Foresight shareholders, 20.9mm from new PIPE investors and 8.7mm from Foresight 9% 4% sponsor. Excludes outstanding public warrants and warrants held by SPAC sponsor and any shares that may be issued in connection with a warrant exchange offer or solicitation of approval to amend the warrants; 3 Assumes no Foresight redemptions; 4 May be reduced to the extent SPAC cash in trust is reduced prior to closing by public stockholder shareholders redemptions; 5 As of 04/30/21; 6 Includes $180mm of cash to the balance sheet from transaction and $14mm from 13% cash on balance sheet of P3 as of 04/30/21 Existing P3 Note: Any lock-up of Company equity holder shares shall be mutually determined by the Company and Foresight in shareholders advance of signing of Definitive Agreements (it being understood that such lock-up may be limited to shares issued 75% to executive officers, directors and parties that currently own five percent or more of the outstanding equity interests of the Company) and shall not exceed 180 days; Cash and debt are shown as of 04/30/21 and may fluctuate prior to, and may be more or less at Closing
Summary Risk Factors Key Risks Relating to P3 Health Group Holdings, LLC (“P3 Health”) and Foresight Acquisition Corp. (“Foresight”) Certain factors may have a material adverse effect on our business, financial condition, and results of operations. The summary risks and uncertainties described below are not the only ones we face. Additional risks and uncertainties that we are unaware of, or that we currently believe are not material, may also become important factors that adversely affect our business. The list below has been prepared solely for purposes of the proposed private placement offering in connection with the proposed business combination (the “Business Combination”) between P3 Health and Foresight Acquisition Corp., a special purpose acquisition company (SPAC), and solely for potential private placement investors in such offering, and not for any other purpose. Accordingly, the list below is qualified in its entirety by disclosures contained in documents filed or furnished in the future by Foresight with the U.S. Securities and Exchange Commission, including the documents to be filed or furnished in connection with the Business Combination. The risks presented in such filings may differ significantly from and be more extensive than those presented below. • We have a history of net losses. We expect to continue to incur losses for the foreseeable future and we may never achieve or maintain profitability. • Our limited operating history makes it difficult to evaluate our future prospects and the risks and challenges we may encounter. • Following the consummation of the Business Combination and private placement offering, we will need to raise additional capital to fund our existing operations, develop and commercialize new services and expand our operations. • The COVID-19 pandemic has impacted, and may continue to impact, our operations and may materially and adversely affect our business and financial results. • We rely on our management team and key employees and our business, financial condition, cash flows and results of operations could be harmed if we are unable to retain qualified personnel. • Our growth depends in part on our ability to identify and develop successful new geographies, physician partners, payors and patients. If we are not able to successfully execute upon our growth strategies, there may be a material adverse effect on our business, financial condition, cash flows and results of operations. • If growth in the number of patients and physician partners on our platform decreases, or the number of products or services that we are able to provide to physician partners and patients decreases, due to legal, economic or business developments, our business, financial condition and results of operations will be harmed. • Under most of our agreements with health plans, we assume some or all of the risk that the cost of providing services will exceed our compensation. A failure to accurately estimate either payments owed to us or incurred but not reported medical expense could adversely affect our results of operations and result in reduced revenues and/or increased expenses and therefore losses that are significantly higher than initially reported or reductions in income. • If the estimates and assumptions we use to project the size, revenue or medical expense amounts are inaccurate, our future growth prospects may be impacted and we may generate additional losses or fail to attain financial performance targets. • We primarily depend on reimbursements by third-party payors, as well as payments by individuals, which could lead to delays and uncertainties in the timing and process of reimbursement, including any changes or reductions in Medicare reimbursement rates or rules. • One of P3 Health’s existing equity holders has asserted it has a contractual option to purchase additional equity interests in P3 Health in connection with the proposed transactions with Foresight. If applicable, it would result in a $25 million capital inflow to the P3 Health and shift the relative equity ownership of the existing P3 Health owners. P3 Health does not agree that such contractual option applies to this transaction as structured, and that specified exceptions apply. P3 Health and Foresight have proposed a transaction structure such that any exercise of the option, if it applied, would not result in dilution to existing investors in Foresight or investors in the private placement. However, no assurance can be made that this issue will not ultimately result in litigation by and among the existing equity holders of P3 Health. • Changes in the payor mix of patients and potential decreases in our reimbursement rates as a result of consolidation among health plans could adversely affect our revenues and results of operations. • The impact on us of recent healthcare legislation and other changes in the healthcare industry and in healthcare spending is currently unknown, but may adversely affect our business, financial condition and results of operations. 40
Summary Risk Factors (Cont’d) • The healthcare industry is intensely regulated at the federal, state and local levels, including regulations regarding our agreements or arrangements with any physician equity holder of our practices, and government authorities may determine that we fail to comply with applicable laws or regulations and take actions against us. In addition, laws regulating the corporate practice of medicine could restrict the manner in which we are permitted to conduct our business, and the failure to comply with such laws could subject us to penalties or require a restructuring of our business. • The termination or non-renewal of the Medicare Advantage contracts between Centers for Medicare and Medicaid Services (CMS) and the health plans with which we contract, or the termination or nonrenewal of our contracts with those plans, could have a material adverse effect on our revenue and our operations. • We are dependent on physician partners and other providers to effectively manage the quality and cost of care and perform obligations under payor contracts. • Reductions in the quality ratings of the health plans we serve could have a material adverse effect on our business, results of operations, financial condition and cash flows. • We have relationships with affiliated independent physicians and group practices that we do not control to provide healthcare services, and our business could be harmed if a material number of those relationships were disrupted or if our arrangements with such providers become subject to legal challenges, liabilities or reputational harm. • Our business is concentrated in certain geographic regions, which makes us sensitive to regulatory, economic, environmental and competitive conditions in those regions. • We depend on our information technology systems, and any failure of these systems could harm our business. • Security breaches, loss of data and other disruptions could compromise sensitive information related to our business or prevent us from accessing critical information and expose us to liability, which could adversely affect our business and our reputation. • If we are unable to obtain and maintain sufficient intellectual property protection for our technology, or if the scope of the intellectual property protection obtained is not sufficiently broad, our competitors could develop and commercialize technology and services similar or identical to ours, and our ability to successfully commercialize our technology and services may be impaired. • If we are unable to protect the confidentiality of our trade secrets, the value of our technology could be materially adversely affected and our business could be harmed. • While we have taken steps to protect our intellectual property, we may be involved in litigation claiming that we have infringed on a third party’s intellectual property or in litigation enforcing our intellectual property, which could be time consuming and costly and may adversely affect our business, financial condition, results of operations and prospects. 41
Summary Risk Factors (Cont’d) Risks Related to the Business Combination and the Private Placement Except as otherwise noted below, references to “we” and “our” below refer to Foresight • Directors of Foresight have potential conflicts of interest in recommending that our stockholders vote in favor of approval of the Business Combination. • Foresight’s initial stockholders, officers and directors have agreed to vote in favor of the Business Combination, regardless of how our public stockholders vote. • Foresight’s sponsors, directors, officers, advisors, and their affiliates may enter into certain transactions, including purchasing shares or warrants from public stockholders, which may influence a vote on the Business Combination and reduce the public “float” of our securities. • Subsequent to the consummation of the Business Combination, we may be required to take write-downs or write-offs, restructuring and impairment or other charges that could have a significant negative effect on our financial condition, results of operations and the price of our securities, which could cause you to lose some or all of your investment. • We may invest or spend the proceeds of the Business Combination and private placement in ways with which the investors may not agree or in ways which may not yield a return. • Each of Foresight and P3 Health have incurred and will incur substantial costs in connection with the Business Combination, private placement and related transactions, such as legal, accounting, consulting, and financial advisory fees, which will be paid out of the proceeds of the Business Combination and the private placement. • There can be no assurance that the common stock issued in connection with the Business Combination will be approved for listing on Nasdaq following the closing, or that we will be able to comply with the continued listing standards of Nasdaq. • The ability of Foresight’s public stockholders to exercise redemption rights with respect to a large number of shares could deplete Foresight’s trust account prior to the Business Combination and thereby diminish the amount of working capital of the combined company. • Uncertainty about the effect of the Business Combination may affect our ability and the ability of P3 Health to retain key employees and integrate management structures and may materially impact the management, strategy, and results of our operation as a combined company. 42

Appendix
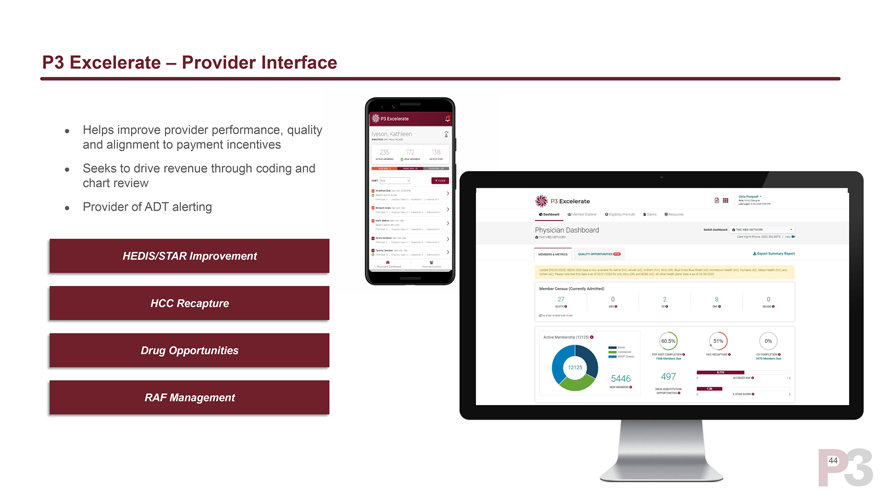
P3 Excelerate – Provider Interface • Helps improve provider performance, quality and alignment to payment incentives • Seeks to drive revenue through coding and chart review • Provider of ADT alerting HEDIS/STAR Improvement HCC Recapture Drug Opportunities RAF Management
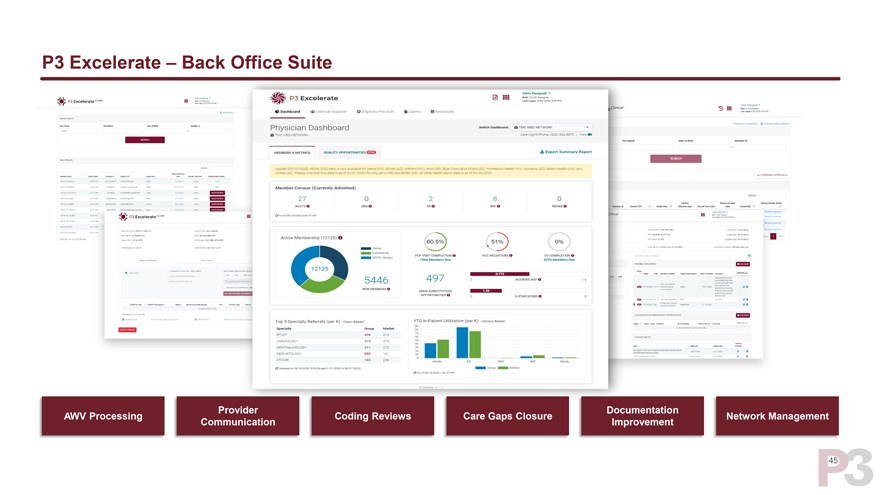
P3 Excelerate – Back Office Suite Provider Documentation AWV Processing Coding Reviews Care Gaps Closure Network Management Communication Improvement 45
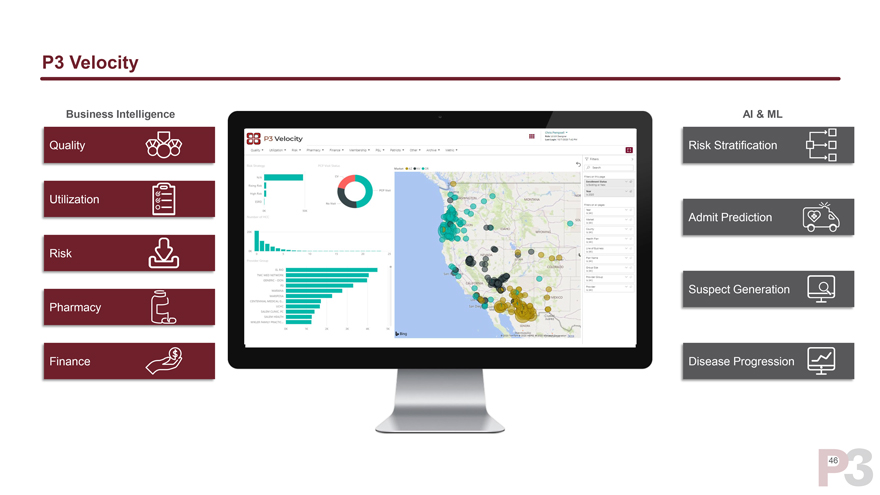
P3 Velocity Business Intelligence AI & ML Quality Risk Stratification Utilization Admit Prediction Risk Suspect Generation Pharmacy Finance Disease Progression 46
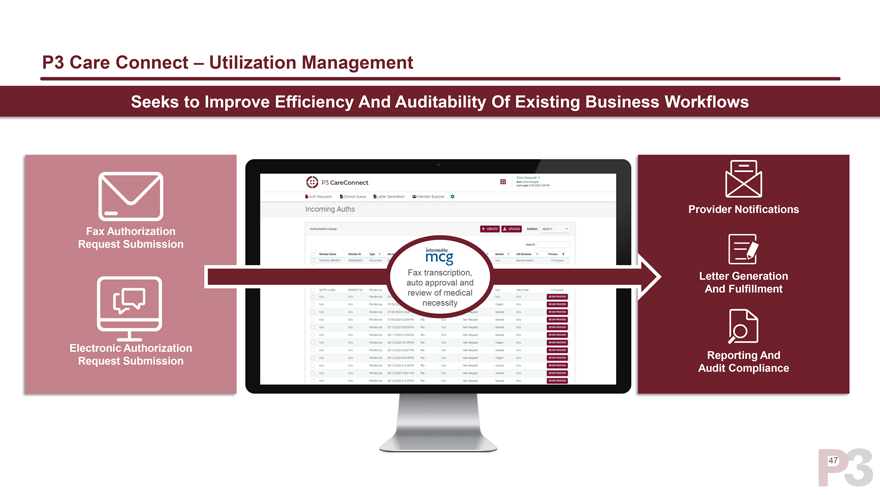
P3 Care Connect – Utilization Management Seeks to Improve Efficiency And Auditability Of Existing Business Workflows Provider Notifications Fax Authorization Request Submission Fax transcription, Letter Generation auto approval and review of medical And Fulfillment necessity Electronic Authorization Reporting And Request Submission Audit Compliance 47
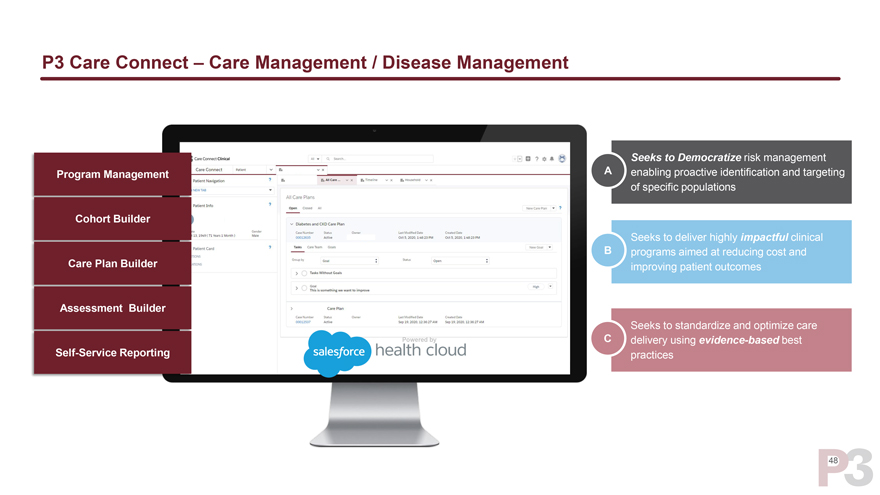
P3 Care Connect – Care Management / Disease Management Seeks to Democratize risk management Program Management A enabling proactive identification and targeting of specific populations Cohort Builder Seeks to deliver highly impactful clinical B programs aimed at reducing cost and Care Plan Builder improving patient outcomes Assessment Builder Seeks to standardize and optimize care Powered by C delivery using evidence-based best Self-Service Reporting practices 48
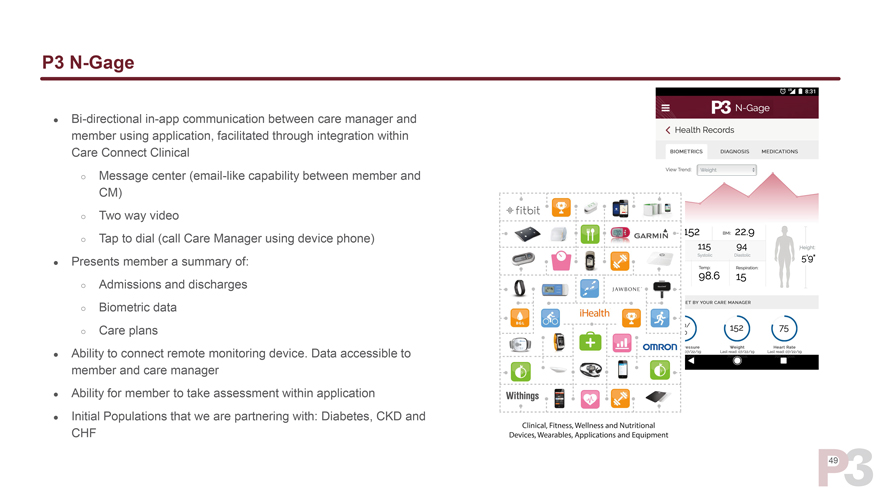
P3 N-Gage • Bi-directional in-app communication between care manager and member using application, facilitated through integration within Care Connect Clinical â—‹ Message center (email-like capability between member and CM) â—‹ Two way video â—‹ Tap to dial (call Care Manager using device phone) • Presents member a summary of: â—‹ Admissions and discharges â—‹ Biometric data â—‹ Care plans • Ability to connect remote monitoring device. Data accessible to member and care manager • Ability for member to take assessment within application • Initial Populations that we are partnering with: Diabetes, CKD and CHF 49
Glossary of Terms ï® Shared savings (lives) – A payment strategy that offers incentives for providers to reduce health care spending for a defined patient population by offering them a percentage of net savings realized as a result of their effortsï® Full-risk (lives) – A strategy that holds provider organizations fully accountable for the health outcomes of their patients; practices are paid a fee for each patient and then cover all the costs of caring for that patientï® Value-based care (“VBC”) - A healthcare delivery model in which providers, including hospitals and physicians, are paid based on patient health outcomes 50
Disclaimer CONFIDENTIALITY AND BASIS OF PRESENTATION The information in this presentation is highly
confidential. The distribution of this presentation by an authorized recipient to any other person is unauthorized. Any photocopying, disclosure, reproduction or alteration of the contents of this presentation and any forwarding of a copy of this
presentation or any portion of this presentation to any person is prohibited. The recipient of this presentation shall keep this presentation and its contents confidential, shall not use this presentation and its contents for any purpose other than
as expressly authorized by P3 Health Partners (“P3”) and Foresight Acquisition Corp (“Foresight” or “SPAC”) and shall be required to return or destroy all copies of this presentation or portions thereof in its
possession promptly following request for the return or destruction of such copies. By accepting delivery of this presentation, the recipient is deemed to agree to the foregoing confidentiality requirements. This presentation is provided for
informational purposes only and has been prepared to assist interested parties in making their own evaluation with respect to a potential business combination (the “proposed business combination”) between P3 and Foresight, and related
transactions, and for no other purpose. No representations or warranties, express or implied are given in, or in respect of, this presentation. To the fullest extent permitted by law, in no circumstances will P3, Foresight or any of their respective
subsidiaries, stockholders, affiliates, representatives, partners, directors, officers, employees, advisers or agents be responsible or liable for any direct, indirect or consequential loss or loss of profit arising from the use of this
presentation, its contents, its omissions, reliance on the information contained within it, or on opinions communicated in relation thereto or otherwise arising in connection therewith. Industry and market data used in this presentation have been
obtained from third party industry publications and sources. None of P3 or Foresight has independently verified the data obtained from these sources and cannot assure you of the data’s accuracy or completeness. This data is subject to change.
In addition, this presentation does not purport to be all-inclusive or to contain all of the information that may be required to make a full analysis of P3 or the proposed business combination. Recipients of
this presentation should each make their own evaluation of P3 and of the relevance and adequacy of the information and should make such other investigations as they deem necessary. FORWARD-LOOKING STATEMENTS Any investment in or purchase of any
securities of P3 or Foresight is speculative and involves a high degree of risk and uncertainty. This presentation includes “forward-looking statements” within the meaning of the “safe harbor” provisions of the United States
Private Securities Litigation Reform Act of 1995. Forward-looking statements may be identified by the use of words such as “estimate,” “plan,” “project,” “forecast,” “intend,” “will,”
“expect,” “anticipate,” “believe,” “seek,” “target” or other similar expressions that predict or indicate future events or trends or that are not statements of historical matters. These
forward-looking statements include, but are not limited to, statements regarding estimates and forecasts of financial and performance metrics, projections of market opportunity and market share, expectations and timing related to site build-outs and
capacity deployment, potential benefits of the transaction and the potential success of P3’s strategy and expectations related to the terms and timing of the proposed business combination and related transactions. These statements are based on
various assumptions, whether or not identified in this presentation, and on the current expectations of P3’s and Foresight’s management and are not predictions of the actual performance. These forward-looking statements are provided for
illustrative purposes only and are not intended to serve as, and must not be relied on by any investor as, a guarantee, an assurance, a prediction or a definitive statement of fact or probability. Actual events and circumstances are difficult or
impossible to predict and will differ from assumptions. Many actual events and circumstances are beyond the control of P3 and Foresight. These forward-looking statements are subject to a number of risks and uncertainties, including changes in
domestic and foreign business, market, financial, political, legal and regulatory conditions; the inability of the parties to successfully or timely consummate the proposed business combination, including the risk that the conditions to the proposed
business combination are not satisfied or waived, including that any required regulatory approvals are not obtained, are delayed or are subject to unanticipated conditions that could adversely affect the combined company or the expected benefits of
the proposed business combination or that the approval of the stockholders of Foresight is not obtained; failure to realize the anticipated benefits of the proposed business combination; risks related to the effects and uncertainties created by the
ongoing COVID-19 pandemic; risks relating to the uncertainty of the projected financial information with respect to P3; risks related to the rollout of P3’s business and the timing of expected
business milestones; risks related to P3’s commercial partnerships, including the inability of P3 and commercial counterparties to enter into definitive agreements; future
global, regional or local economic and market conditions; the development, effects and enforcement of laws and regulations; P3’s ability to manage future growth; P3’s ability to develop new products and solutions, bring them to market in a
timely manner, and make enhancements to its platform; the effects of competition on P3’s future business; the amount of redemption requests made by Foresight’s public stockholders; the ability of Foresight or the combined company to issue
equity or equity-linked securities in connection with the proposed business combination or in the future; the outcome of any potential litigation, government and regulatory proceedings, investigations and inquiries; and those factors discussed in
Foresight’s Annual Report on Form 10-K for the year ended December 31, 2020 and filed with the SEC on April 6, 2021 (the “Annual Report”)under the heading “Risk Factors,” and
other documents of Foresight filed, or to be filed, with the SEC. If any of these risks materialize or our assumptions prove incorrect, actual results could differ materially from the results implied by these forward-looking statements. There may be
additional risks that neither Foresight nor P3 presently know or that Foresight and P3 currently believe are immaterial that could also cause actual results to differ from those contained in the forward-looking statements. In addition,
forward-looking statements reflect Foresight’s and P3’s expectations, plans or forecasts of future events and views as of the date of this presentation. Foresight and P3 anticipate that subsequent events and developments will cause
Foresight’s and P3’s assessments to change. However, while Foresight and P3 may elect to update these forward-looking statements at some point in the future, Foresight and P3 specifically disclaim any obligation to do so. These
forward-looking statements should not be relied upon as representing Foresight’s and P3’s assessments as of any date subsequent to the date of this presentation. Accordingly, undue reliance should not be placed upon the forward-looking
statements. 51
Disclaimer USE OF PROJECTIONS AND DESCRIPTION OF KEY CONTRACTS AND PARTNERSHIPS This presentation contains projected financial information with respect to P3, namely revenue, gross profit, EBITDA, EBITDA Margin and capital expenditures for 2021-2025. Such projected financial information constitutes forward-looking information, and is for illustrative purposes only and should not be relied upon as necessarily being indicative of future results. The assumptions and estimates underlying such projected financial information are inherently uncertain and are subject to a wide variety of significant business, economic, competitive and other risks and uncertainties that could cause actual results to differ materially from those contained in the prospective financial information. See “Forward-Looking Statements” above. Actual results may differ materially from the results contemplated by the projected financial information contained in this presentation, and the inclusion of such information in this presentation should not be regarded as a representation by any person that the results reflected in such projections will be achieved. Neither the independent auditors of Foresight nor the independent auditors of P3, audited, reviewed, compiled, or performed any procedures with respect to the projections for the purpose of their inclusion in this presentation, and accordingly, neither of them expressed an opinion or provided any other form of assurance with respect thereto for the purpose of this presentation. This presentation contains descriptions of certain key business partnerships of P3. These descriptions are based on the P3 management team’s discussions with such counterparties and the latest available information and estimates as of the date of this presentation. In each case, such descriptions are subject to negotiation and execution of definitive agreements with such counterparties which have not been completed as of the date of this presentation and, as a result, such descriptions of key business partnerships of P3, remain subject to change FINANCIAL INFORMATION; NON-GAAP FINANCIAL MEASURES The financial information and data contained in this presentation is unaudited and does not conform to Regulation S-X. Accordingly, such information and data may not be included in, may be adjusted in or may be presented differently in, any proxy statement, registration statement, or prospectus to be filed by Foresight with the SEC. Some of the financial information and data contained in this presentation, such as EBITDA and EBITDA Margin have not been prepared in accordance with United States generally accepted accounting principles (“GAAP”). EBITDA is defined as net earnings (loss) before interest expense, income tax expense (benefit), depreciation and amortization. Foresight and P3 believe these non-GAAP measures of financial results provide useful information to management and investors regarding certain financial and business trends relating to P3’s financial condition and results of operations. Foresight and P3 believe that the use of these non-GAAP financial measures provides an additional tool for investors to use in evaluating projected operating results and trends in and in comparing P3’s financial measures with other similar companies, many of which present similar non-GAAP financial measures to investors. Management does not consider these non-GAAP measures in isolation or as an alternative to financial measures determined in accordance with GAAP. The principal limitation of these non-GAAP financial measures is that they exclude significant expenses and income that are required by GAAP to be recorded in P3’s financial statements. In addition, they are subject to inherent limitations as they reflect the exercise of judgments by management about which expense and income are excluded or included in determining these non-GAAP financial measures. P3 is not providing a reconciliation of its projected EBITDA, EBITDA Margin and other metrics for full years 2021-2025 to the most directly comparable measure prepared in accordance with GAAP because P3 is unable to provide this reconciliation without unreasonable effort due to the uncertainty and inherent difficulty of predicting the occurrence, the financial impact, and the periods in which the adjustments may be recognized. For the same reasons, P3 is unable to address the probable significance of the unavailable information, which could be material to future results. ADDITIONAL INFORMATION ABOUT THE PROPOSED BUSINESS COMBINATION AND WHERE TO FIND IT The proposed business combination will be submitted to stockholders of Foresight for their consideration. Foresight intends to file a proxy statement (the “Proxy Statement”) with the SEC to be distributed to Foresight’s stockholders in connection with Foresight’s solicitation of proxies for the vote by Foresight’s stockholders in connection with the proposed business combination and other matters as described in the Proxy Statement. After the definitive Proxy Statement has been filed, Foresight will mail the definitive Proxy Statement and other relevant documents to its stockholders as of the record date established for voting on the proposed business combination. Foresight’s stockholders and other interested persons are advised to read, once available, the preliminary Proxy Statement and any amendments thereto and, once available, the definitive Proxy Statement, in connection with Foresight’s solicitation of proxies for its special meeting of stockholders to be held to approve, among other things, the proposed business combination, because these documents will contain important information about Foresight, P3 and the proposed business combination. Investors and securities holders may also obtain a copy of the preliminary or definitive Proxy Statement, once available, as well as other documents filed with the SEC regarding the proposed business combination and other documents filed with the SEC by Foresight, without charge, at the SEC’s website located at www.sec.gov or by directing a request to Gateway Investor Relations, (949) 574-3860, FORE@gatewayir.com. INVESTMENT IN ANY SECURITIES DESCRIBED HEREIN HAS NOT BEEN APPROVED OR DISAPPROVED BY THE SEC OR ANY OTHER REGULATORY AUTHORITY NOR HAS ANY AUTHORITY PASSED UPON OR ENDORSED THE MERITS OF THE OFFERING OR THE ACCURACY OR ADEQUACY OF THE INFORMATION CONTAINED HEREIN ANY REPRESENTATION TO THE CONTRARY IS A CRIMINAL OFFENSE. 52
Disclaimer PARTICIPANTS IN THE SOLICITATION Foresight, P3 and certain of their respective directors, executive officers and other members of management and employees may, under SEC rules, be deemed to be participants in the solicitations of proxies from Foresight’s stockholders in connection with the proposed business combination. Information regarding the persons who may, under SEC rules, be deemed participants in the solicitation of Foresight’s stockholders in connection with the proposed business combination will be set forth in the Proxy Statement when it is filed with the SEC. You can find more information about Foresight’s directors and executive officers in Foresight’s Annual Report. Additional information regarding the participants in the proxy solicitation and a description of their direct and indirect interests will be included in the Proxy Statement when it becomes available. Stockholders, potential investors and other interested persons should read the Proxy Statement carefully when it becomes available before making any voting or investment decisions. You may obtain free copies of these documents from the sources indicated above. NO OFFER OR SOLICITATION This presentation does not constitute an offer to sell or the solicitation of an offer to buy any securities, or a solicitation of any vote or approval, nor shall there be any sale of securities in any jurisdiction in which such offer, solicitation or sale would be unlawful prior to registration or qualification under the securities laws of any such jurisdiction. TRADEMARKS This presentation contains trademarks, service marks, trade names and copyrights of P3, Foresight and other companies, which are the property of their respective owners. 53