| Who: People with Passion and Purpose What: Dedicated to Transforming Healthcare for Patients, Providers, and Payors How: Patient-Centric, Physician-Led, and Population Health Management Focused Cowen Healthcare Conference March 2022 |

| 1 Forward Looking Statement and Non-GAAP Financial Information FORWARD-LOOKING STATEMENTS Any investment in or purchase of any securities of P3 Health Group Inc. (the “Company” or “P3”) is speculative and involves a high degree of risk and uncertainty. This presentation includes “forward-looking statements” within the meaning of the “safe harbor” provisions of the United States Private Securities Litigation Reform Act of 1995. Forward-looking statements may be identified by the use of words such as “estimate,” “plan,” “project,” “forecast,” “intend,” “will,” “expect,” “anticipate,” “believe,” “seek,” “target” or other similar expressions that predict or indicate future events or trends or that are not statements of historical matters. These forward-looking statements include, but are not limited to, statements regarding estimates and forecasts of financial and performance metrics, projections of market opportunity and market share, expectations and timing related to site build-outs and capacity deployment, and the potential success of P3's strategy. These statements are based on various assumptions, whether or not identified in this presentation, and on the current expectations of P3’s management and are not predictions of the actual performance. These forward-looking statements are provided for illustrative purposes only and are not intended to serve as, and must not be relied on by any investor as, a guarantee, an assurance, a prediction or a definitive statement of fact or probability. Actual events and circumstances are difficult or impossible to predict and will differ from assumptions. Many actual events and circumstances are beyond the control of P3. These forward-looking statements are subject to a number of risks and uncertainties, including changes in domestic and foreign business, market, financial, political, legal and regulatory conditions; failure to realize the anticipated benefits of the business combination; risks related to the effects and uncertainties created by the ongoing COVID-19 pandemic; risks relating to the uncertainty of the projected financial information with respect to P3; risks related to the rollout of P3’s business and the timing of expected business milestones; risks related to P3’s commercial partnerships, including the inability of P3 and commercial counterparties to enter into definitive agreements; future global, regional or local economic and market conditions; the development, effects and enforcement of laws and regulations; P3’s ability to manage future growth; P3’s ability to develop new products and solutions, bring them to market in a timely manner, and make enhancements to its platform; the effects of competition on P3’s future business; the ability of P3 to issue equity or equity-linked securities in the future; the outcome of any potential litigation, government and regulatory proceedings, investigations and inquiries; and those factors discussed in P3’s Registration Statement on Form S-1 filed with the SEC on December 28, 2021 under the heading “Risk Factors,” and other documents of P3 filed, or to be filed, with the SEC. If any of these risks materialize or our assumptions prove incorrect, actual results could differ materially from the results implied by these forward-looking statements. There may be additional risks that P3 presently knows or that P3 currently believes are immaterial that could also cause actual results to differ from those contained in the forward-looking statements. In addition, forward-looking statements reflect P3’s expectations, plans or forecasts of future events and views as of the date of this presentation. P3 anticipates that subsequent events and developments will cause P3’s assessments to change. However, while P3 may elect to update these forward-looking statements at some point in the future, P3 specifically disclaims any obligation to do so. These forward-looking statements should not be relied upon as representing P3’s assessments as of any date subsequent to the date of this presentation. Accordingly, undue reliance should not be placed upon the forward-looking statements. USE OF PROJECTIONS AND DESCRIPTION OF KEY CONTRACTS AND PARTNERSHIPS This presentation contains projected financial information with respect to P3, namely revenue for 2021. Such projected financial information constitutes forward-looking information, and is for illustrative purposes only and should not be relied upon as necessarily being indicative of future results. The assumptions and estimates underlying such projected financial information are inherently uncertain and are subject to a wide variety of significant business, economic, competitive and other risks and uncertainties that could cause actual results to differ materially from those contained in the prospective financial information. See “Forward-Looking Statements” above. Actual results may differ materially from the results contemplated by the projected financial information contained in this presentation, and the inclusion of such information in this presentation should not be regarded as a representation by any person that the results reflected in such projections will be achieved. Neither the independent auditors of P3, audited, reviewed, compiled, or performed any procedures with respect to the projections for the purpose of their inclusion in this presentation, and accordingly, neither of them expressed an opinion or provided any other form of assurance with respect thereto for the purpose of this presentation. This presentation contains descriptions of certain key business partnerships of P3. These descriptions are based on the P3 management team’s discussions with such counterparties and the latest available information and estimates as of the date of this presentation. In each case, such descriptions are subject to negotiation and execution of definitive agreements with such counterparties which have not been completed as of the date of this presentation and, as a result, such descriptions of key business partnerships of P3, remain subject to change FINANCIAL INFORMATION; NON-GAAP FINANCIAL MEASURES The financial information and data contained in this presentation is unaudited and does not conform to Regulation S-X. Accordingly, such information and data may not be included in, may be adjusted in or may be presented differently in, any proxy statement, registration statement, or prospectus to be filed by P3 with the SEC. Some of the financial information and data contained in this presentation, such as EBITDA and EBITDA Margin have not been prepared in accordance with United States generally accepted accounting principles (“GAAP”). EBITDA is defined as net earnings (loss) before interest expense, income tax expense (benefit), depreciation and amortization. P3 believes these non-GAAP measures of financial results provide useful information to management and investors regarding certain financial and business trends relating to P3’sfinancial condition and results of operations. P3 believes that the use of these non-GAAP financial measures provides an additional tool for investors to use in evaluating projected operating results and trends in and in comparing P3’s financial measures with other similar companies, many of which present similar non-GAAP financial measures to investors. Management does not consider these non-GAAP measures in isolation or as an alternative to financial measures determined in accordance with GAAP. The principal limitation of these non-GAAP financial measures is that they exclude significant expenses and income that are required by GAAP to be recorded in P3’s financial statements. In addition, they are subject to inherent limitations as they reflect the exercise of judgments by management about which expense and income are excluded or included in determining these non-GAAP financial measures. P3 is not providing a reconciliation of its projected long-term EBITDA Margin to the most directly comparable measure prepared in accordance with GAAP because P3 is unable to provide this reconciliation without unreasonable effort due to the uncertainty and inherent difficulty of predicting the occurrence, the financial impact, and the periods in which the adjustments may be recognized. For the same reasons, P3 is unable to address the probable significance of the unavailable information, which could be material to future results. TRADEMARKS This presentation contains trademarks, service marks, trade names and copyrights of P3 and other companies, which are the property of their respective owners. |
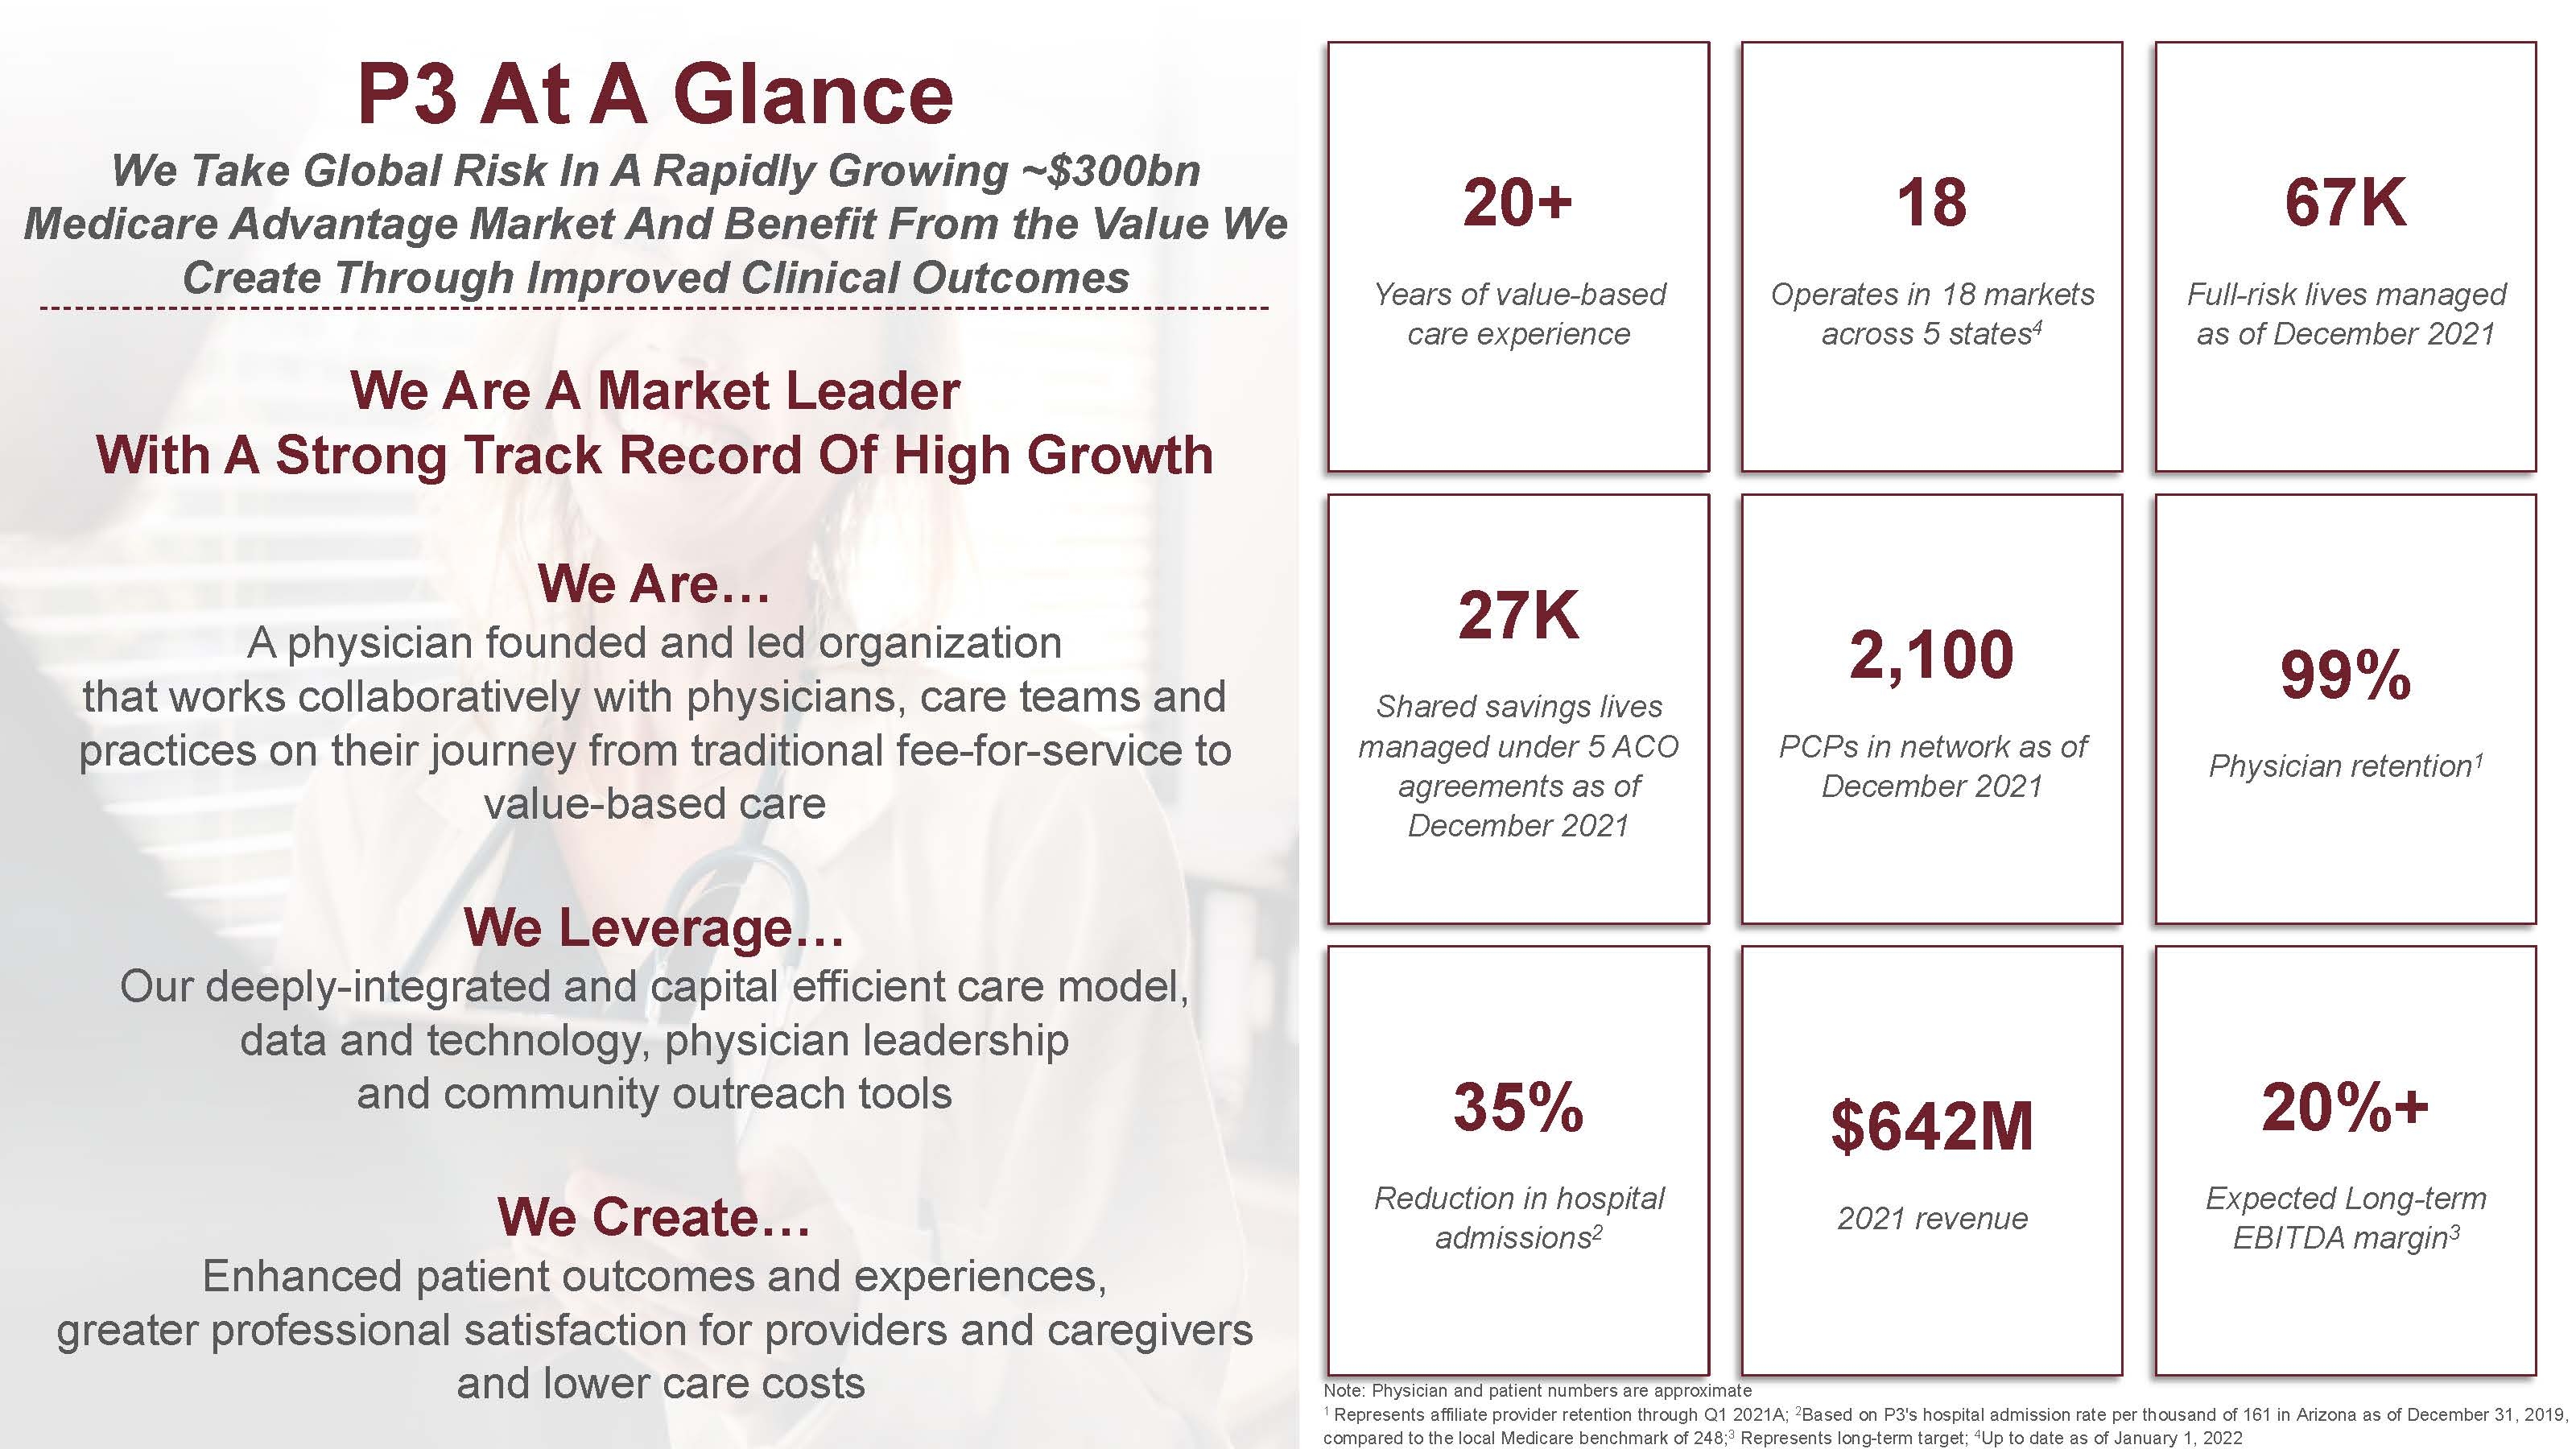
| P3 At A Glance We Take Global Risk In A Rapidly Growing ~$300bn Medicare Advantage Market And Benefit From the Value We Create Through Improved Clinical Outcomes We Are A Market Leader With A Strong Track Record Of High Growth We Are… A physician founded and led organization that works collaboratively with physicians, care teams and practices on their journey from traditional fee-for-service to value-based care We Leverage… Our deeply-integrated and capital efficient care model, data and technology, physician leadership and community outreach tools We Create… Enhanced patient outcomes and experiences, greater professional satisfaction for providers and caregivers and lower care costs 20+ Years of value-based care experience 99% Physician retention1 18 Operates in 18 markets across 5 states4 $642M 2021 revenue 20%+ Expected Long-term EBITDA margin3 67K Full-risk lives managed as of December 2021 27K Shared savings lives managed under 5 ACO agreements as of December 2021 Note: Physician and patient numbers are approximate 1 Represents affiliate provider retention through Q1 2021A; 2Based on P3's hospital admission rate per thousand of 161 in Arizona as of December 31, 2019, compared to the local Medicare benchmark of 248;3 Represents long-term target; 4Up to date as of January 1, 2022 35% Reduction in hospital admissions2 2,100 PCPs in network as of December 2021 |
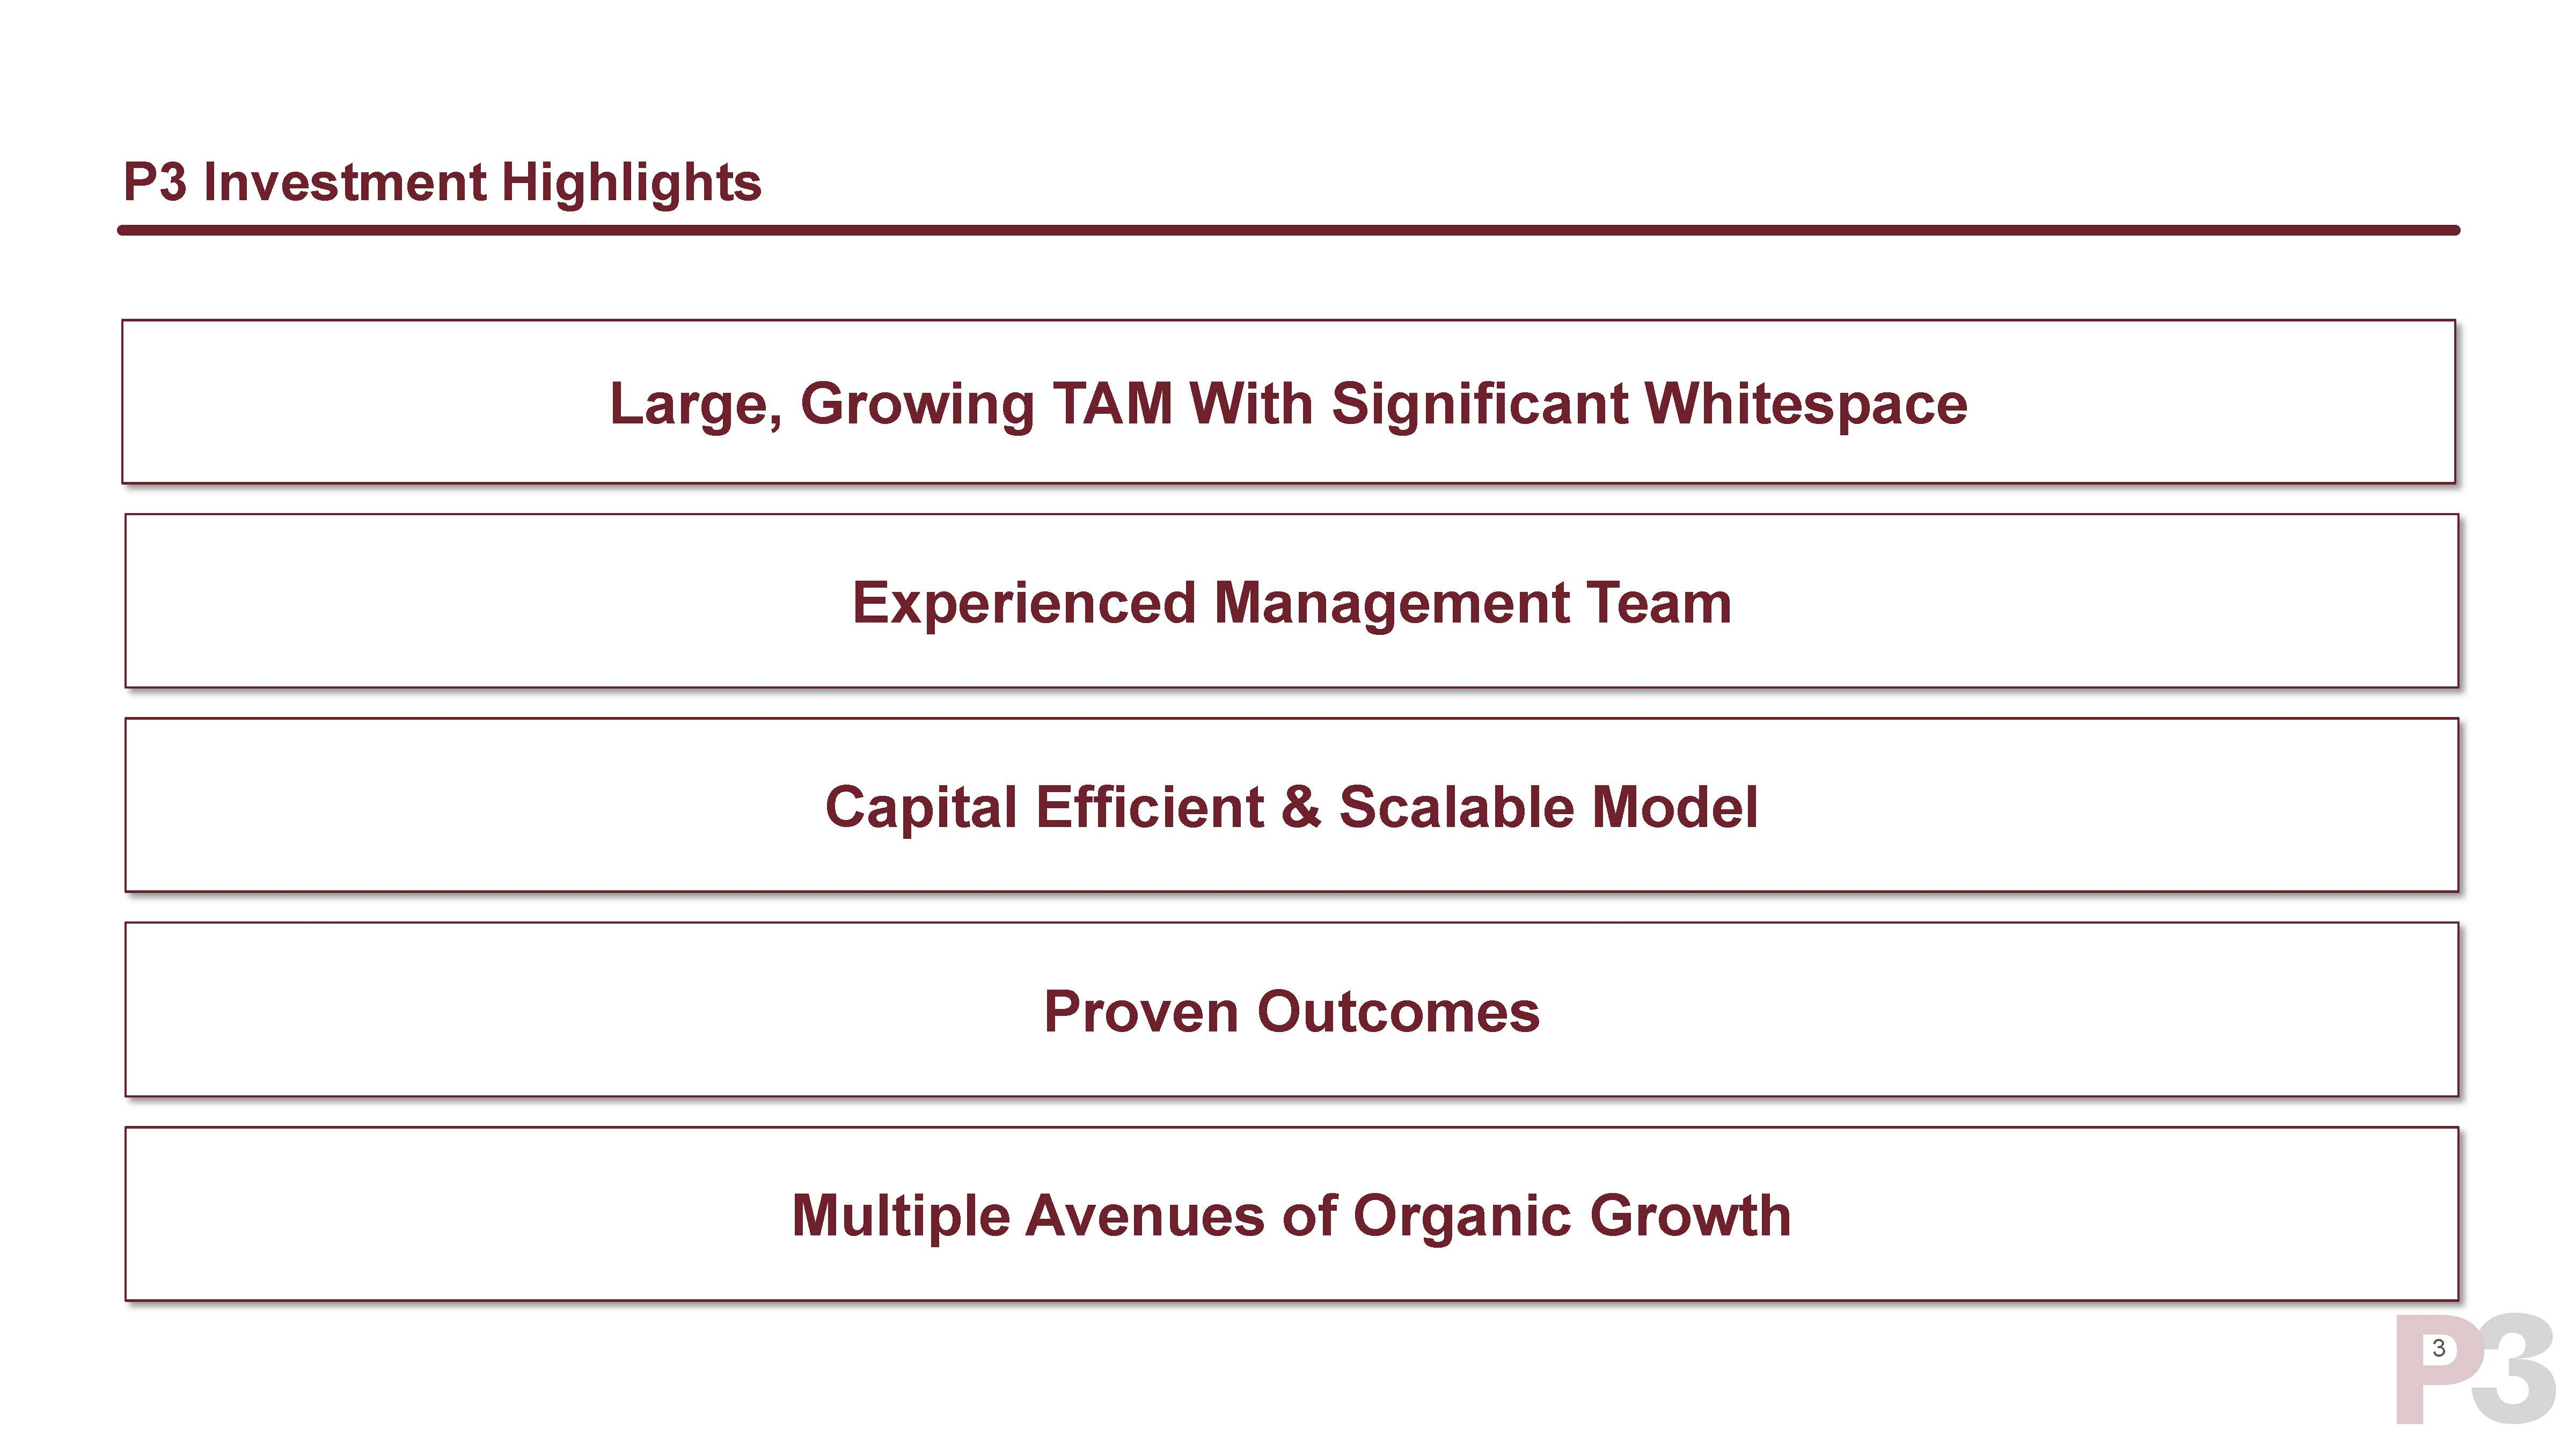
| 3 P3 Investment Highlights Experienced Management Team Capital Efficient & Scalable Model Proven Outcomes Multiple Avenues of Organic Growth Large, Growing TAM With Significant Whitespace |
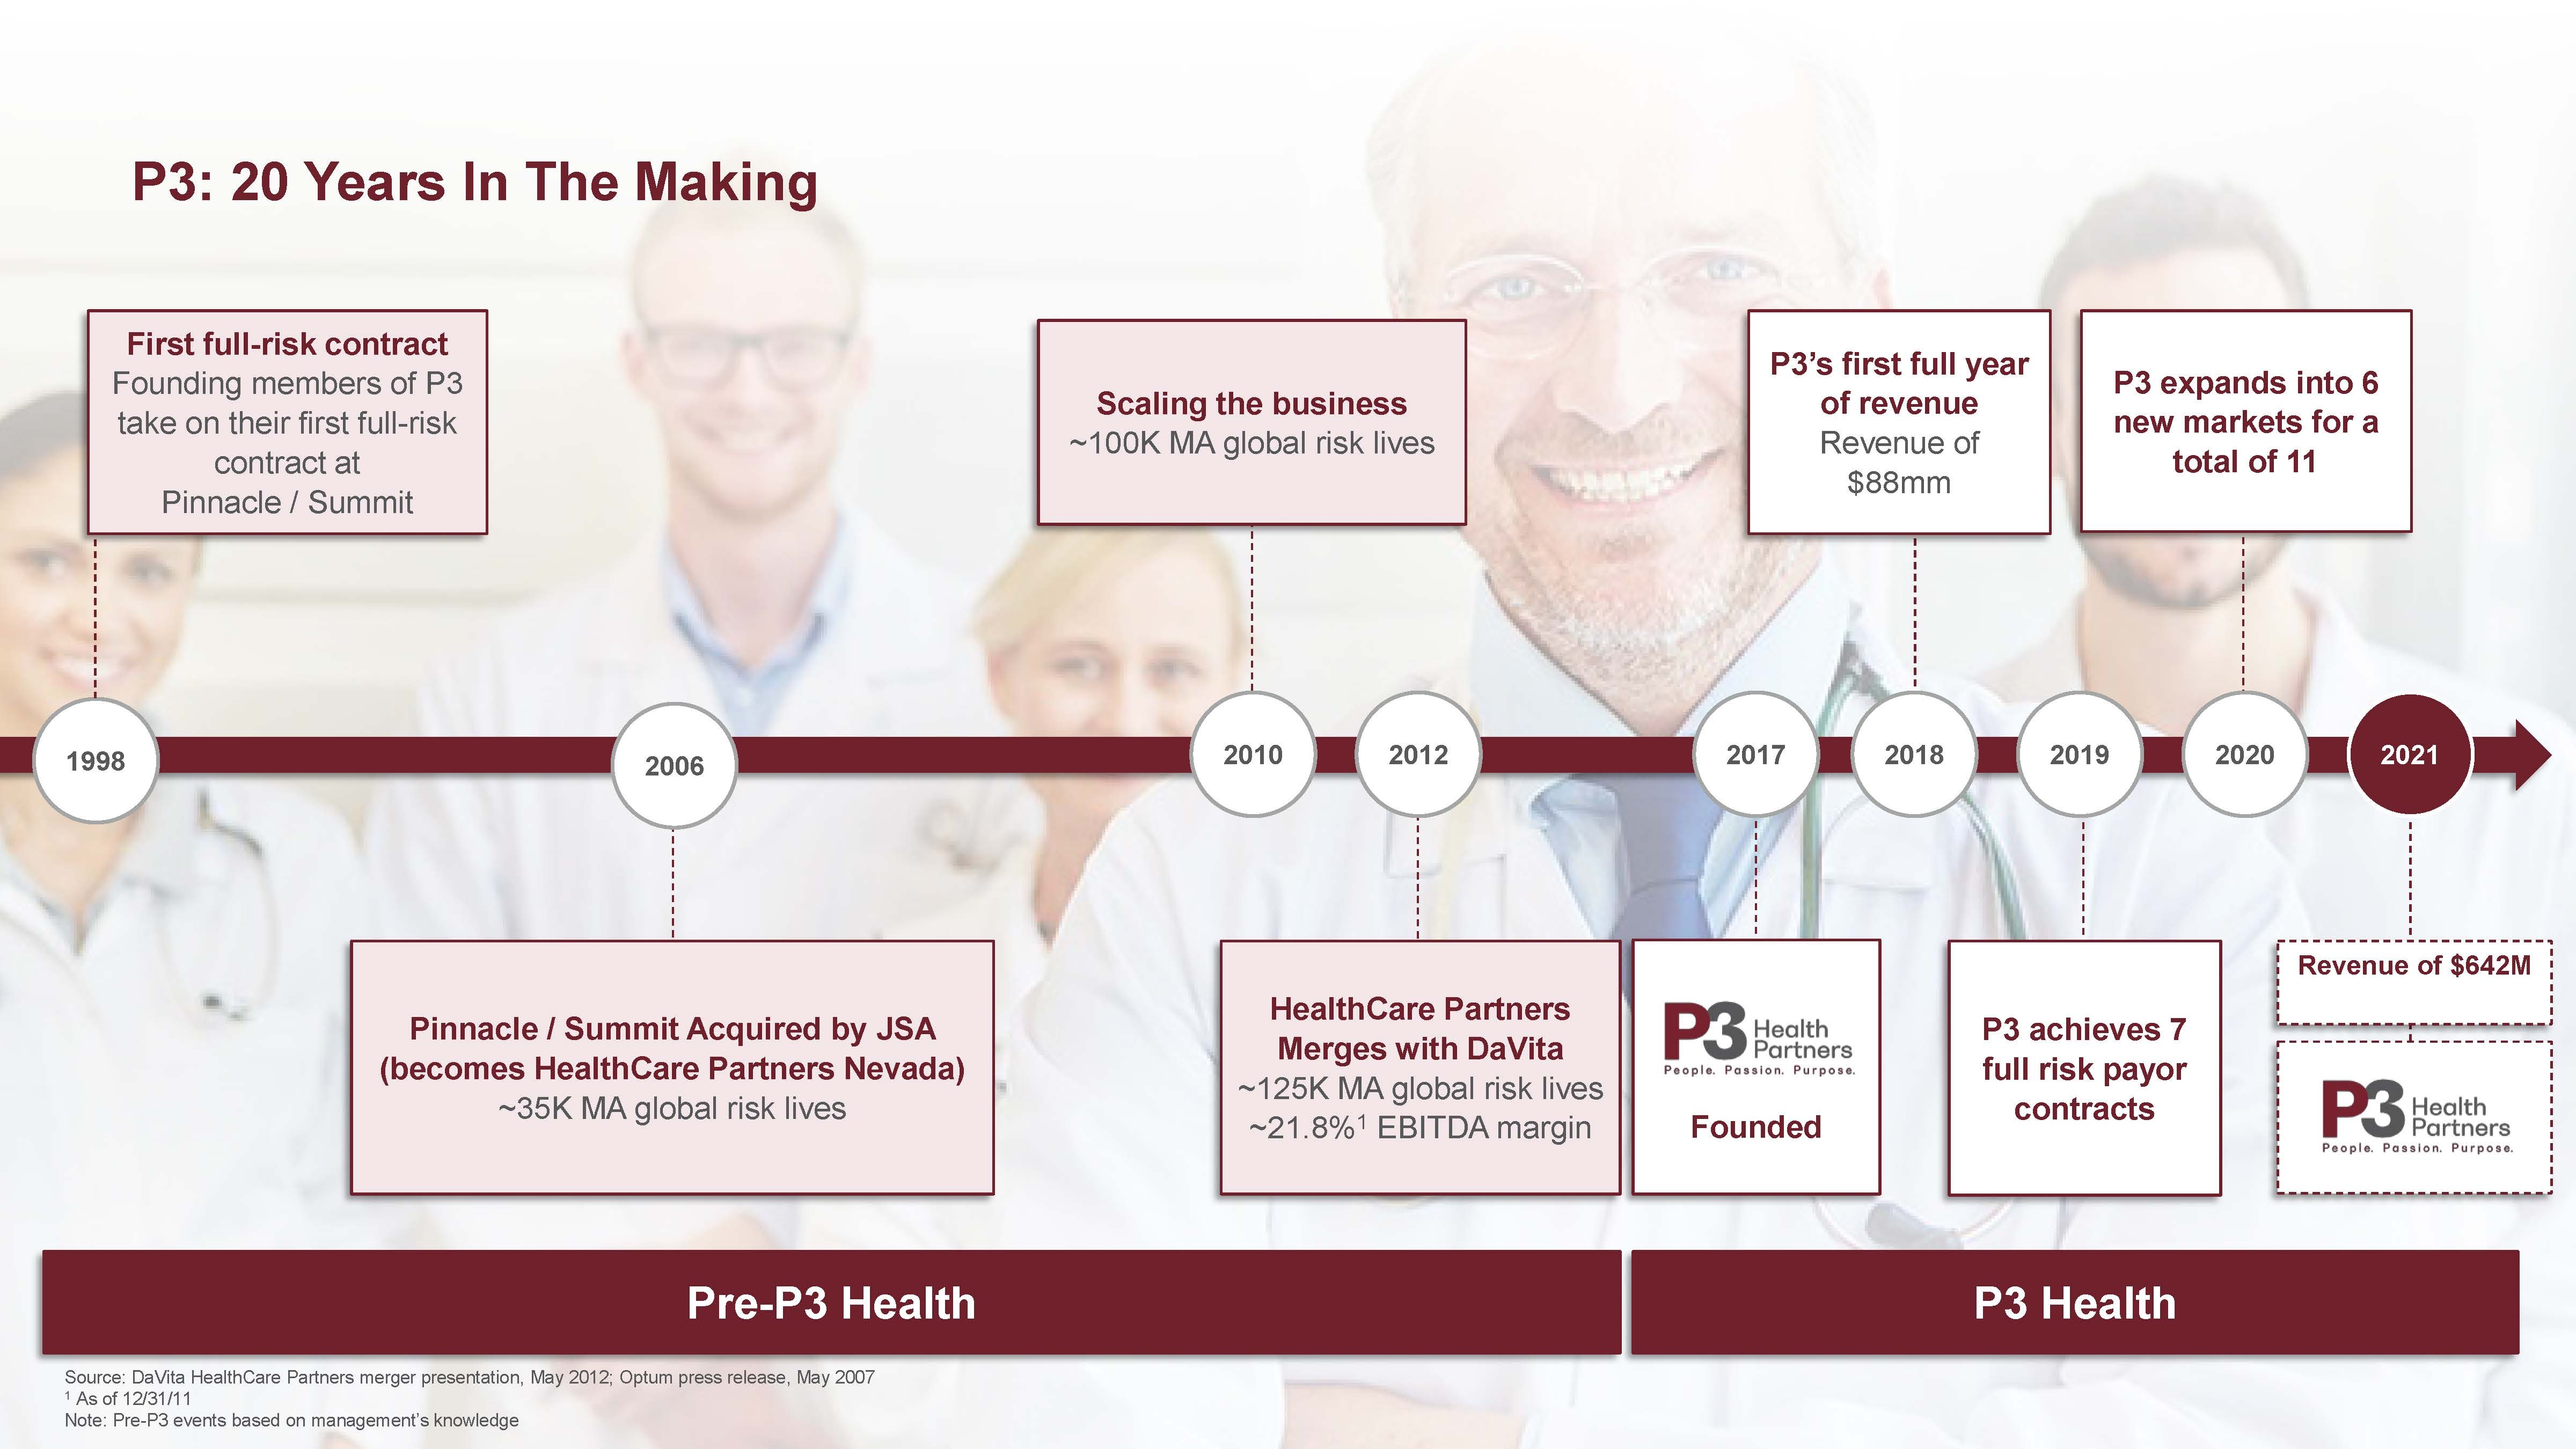
| 4 Revenue of $642M P3 expands into 6 new markets for a total of 11 P3 achieves 7 full risk payor contracts P3’s first full year of revenue Revenue of $88mm HealthCare Partners Merges with DaVita ~125K MA global risk lives ~21.8%1 EBITDA margin Scaling the business ~100K MA global risk lives Pinnacle / Summit Acquired by JSA (becomes HealthCare Partners Nevada) ~35K MA global risk lives P3: 20 Years In The Making 1998 2006 2021 2010 2012 2020 2019 2018 First full-risk contract Founding members of P3 take on their first full-risk contract at Pinnacle / Summit Pre-P3 Health P3 Health Source: DaVita HealthCare Partners merger presentation, May 2012; Optum press release, May 2007 1 As of 12/31/11 Note: Pre-P3 events based on management’s knowledge Founded 2017 |
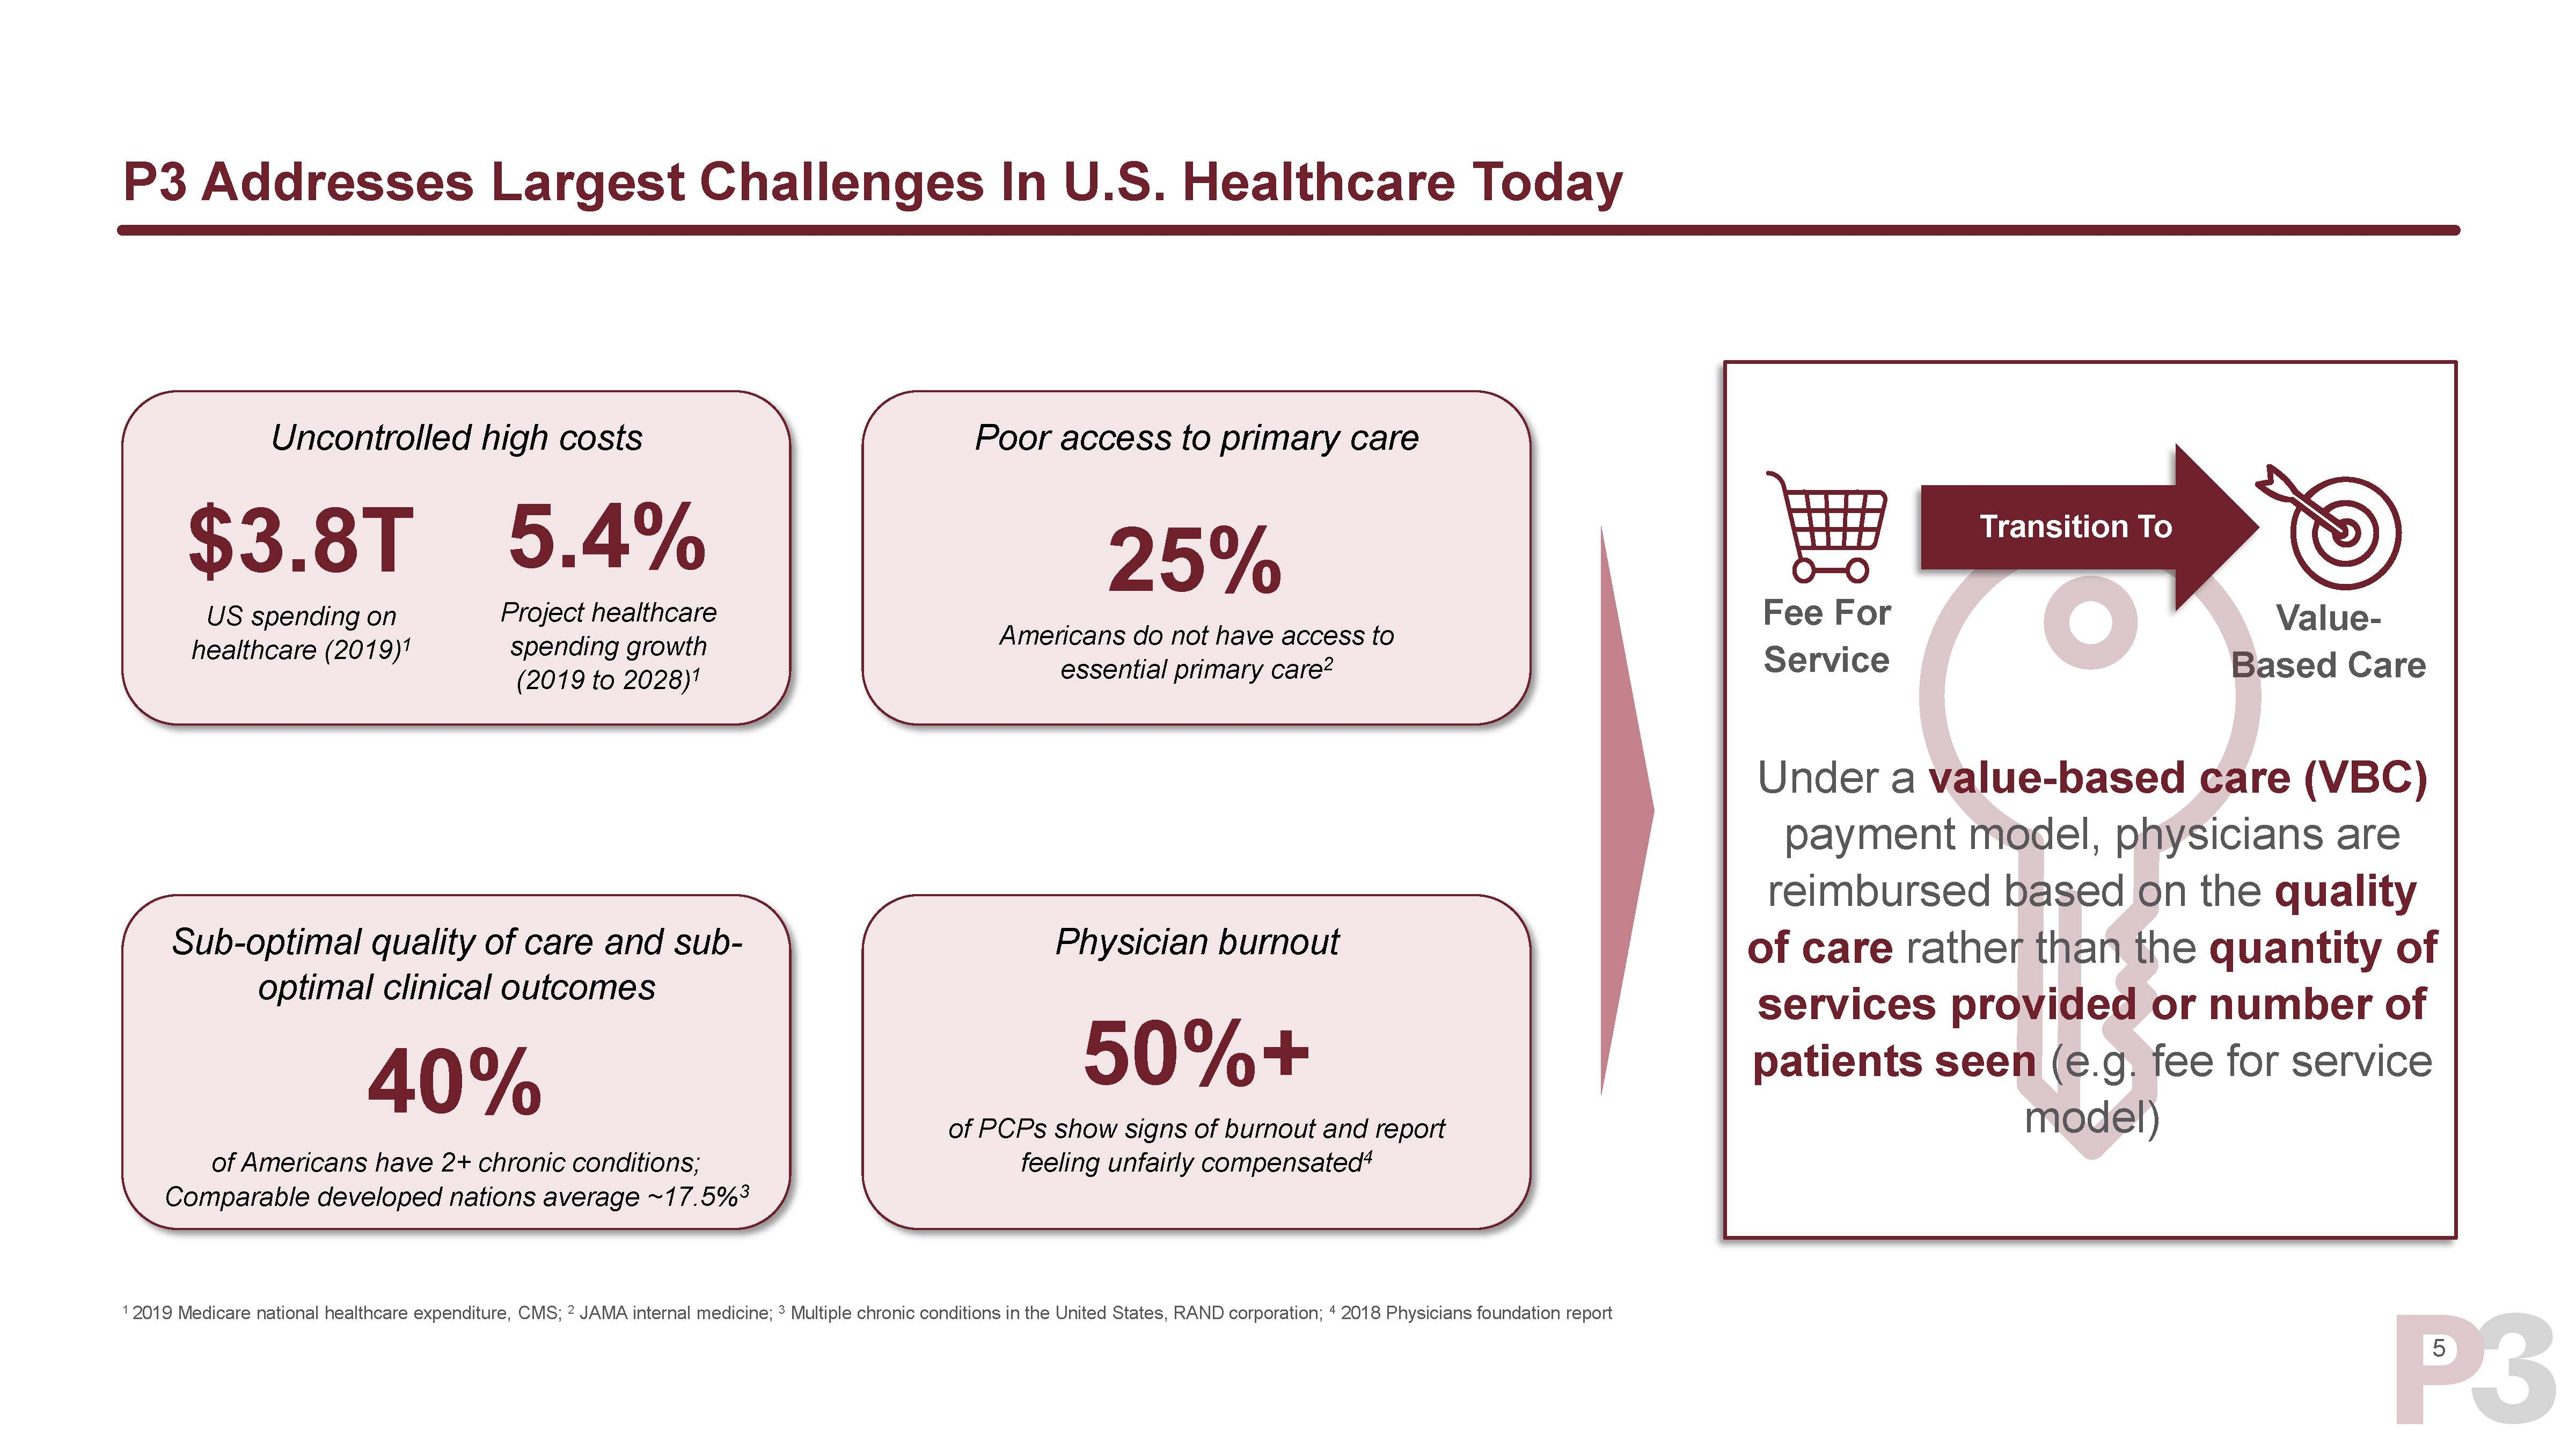
| 5 P3 Addresses Largest Challenges In U.S. Healthcare Today Uncontrolled high costs Poor access to primary care 25% Americans do not have access to essential primary care2 Sub-optimal quality of care and sub- optimal clinical outcomes 40% of Americans have 2+ chronic conditions; Comparable developed nations average ~17.5%3 Physician burnout 50%+ of PCPs show signs of burnout and report feeling unfairly compensated4 $3.8T US spending on healthcare (2019)1 5.4% Project healthcare spending growth (2019 to 2028)1 1 2019 Medicare national healthcare expenditure, CMS; 2 JAMA internal medicine; 3 Multiple chronic conditions in the United States, RAND corporation; 4 2018 Physicians foundation report Value- Based Care Fee For Service Transition To Under a value-based care (VBC) payment model, physicians are reimbursed based on the quality of care rather than the quantity of services provided or number of patients seen (e.g. fee for service model) |
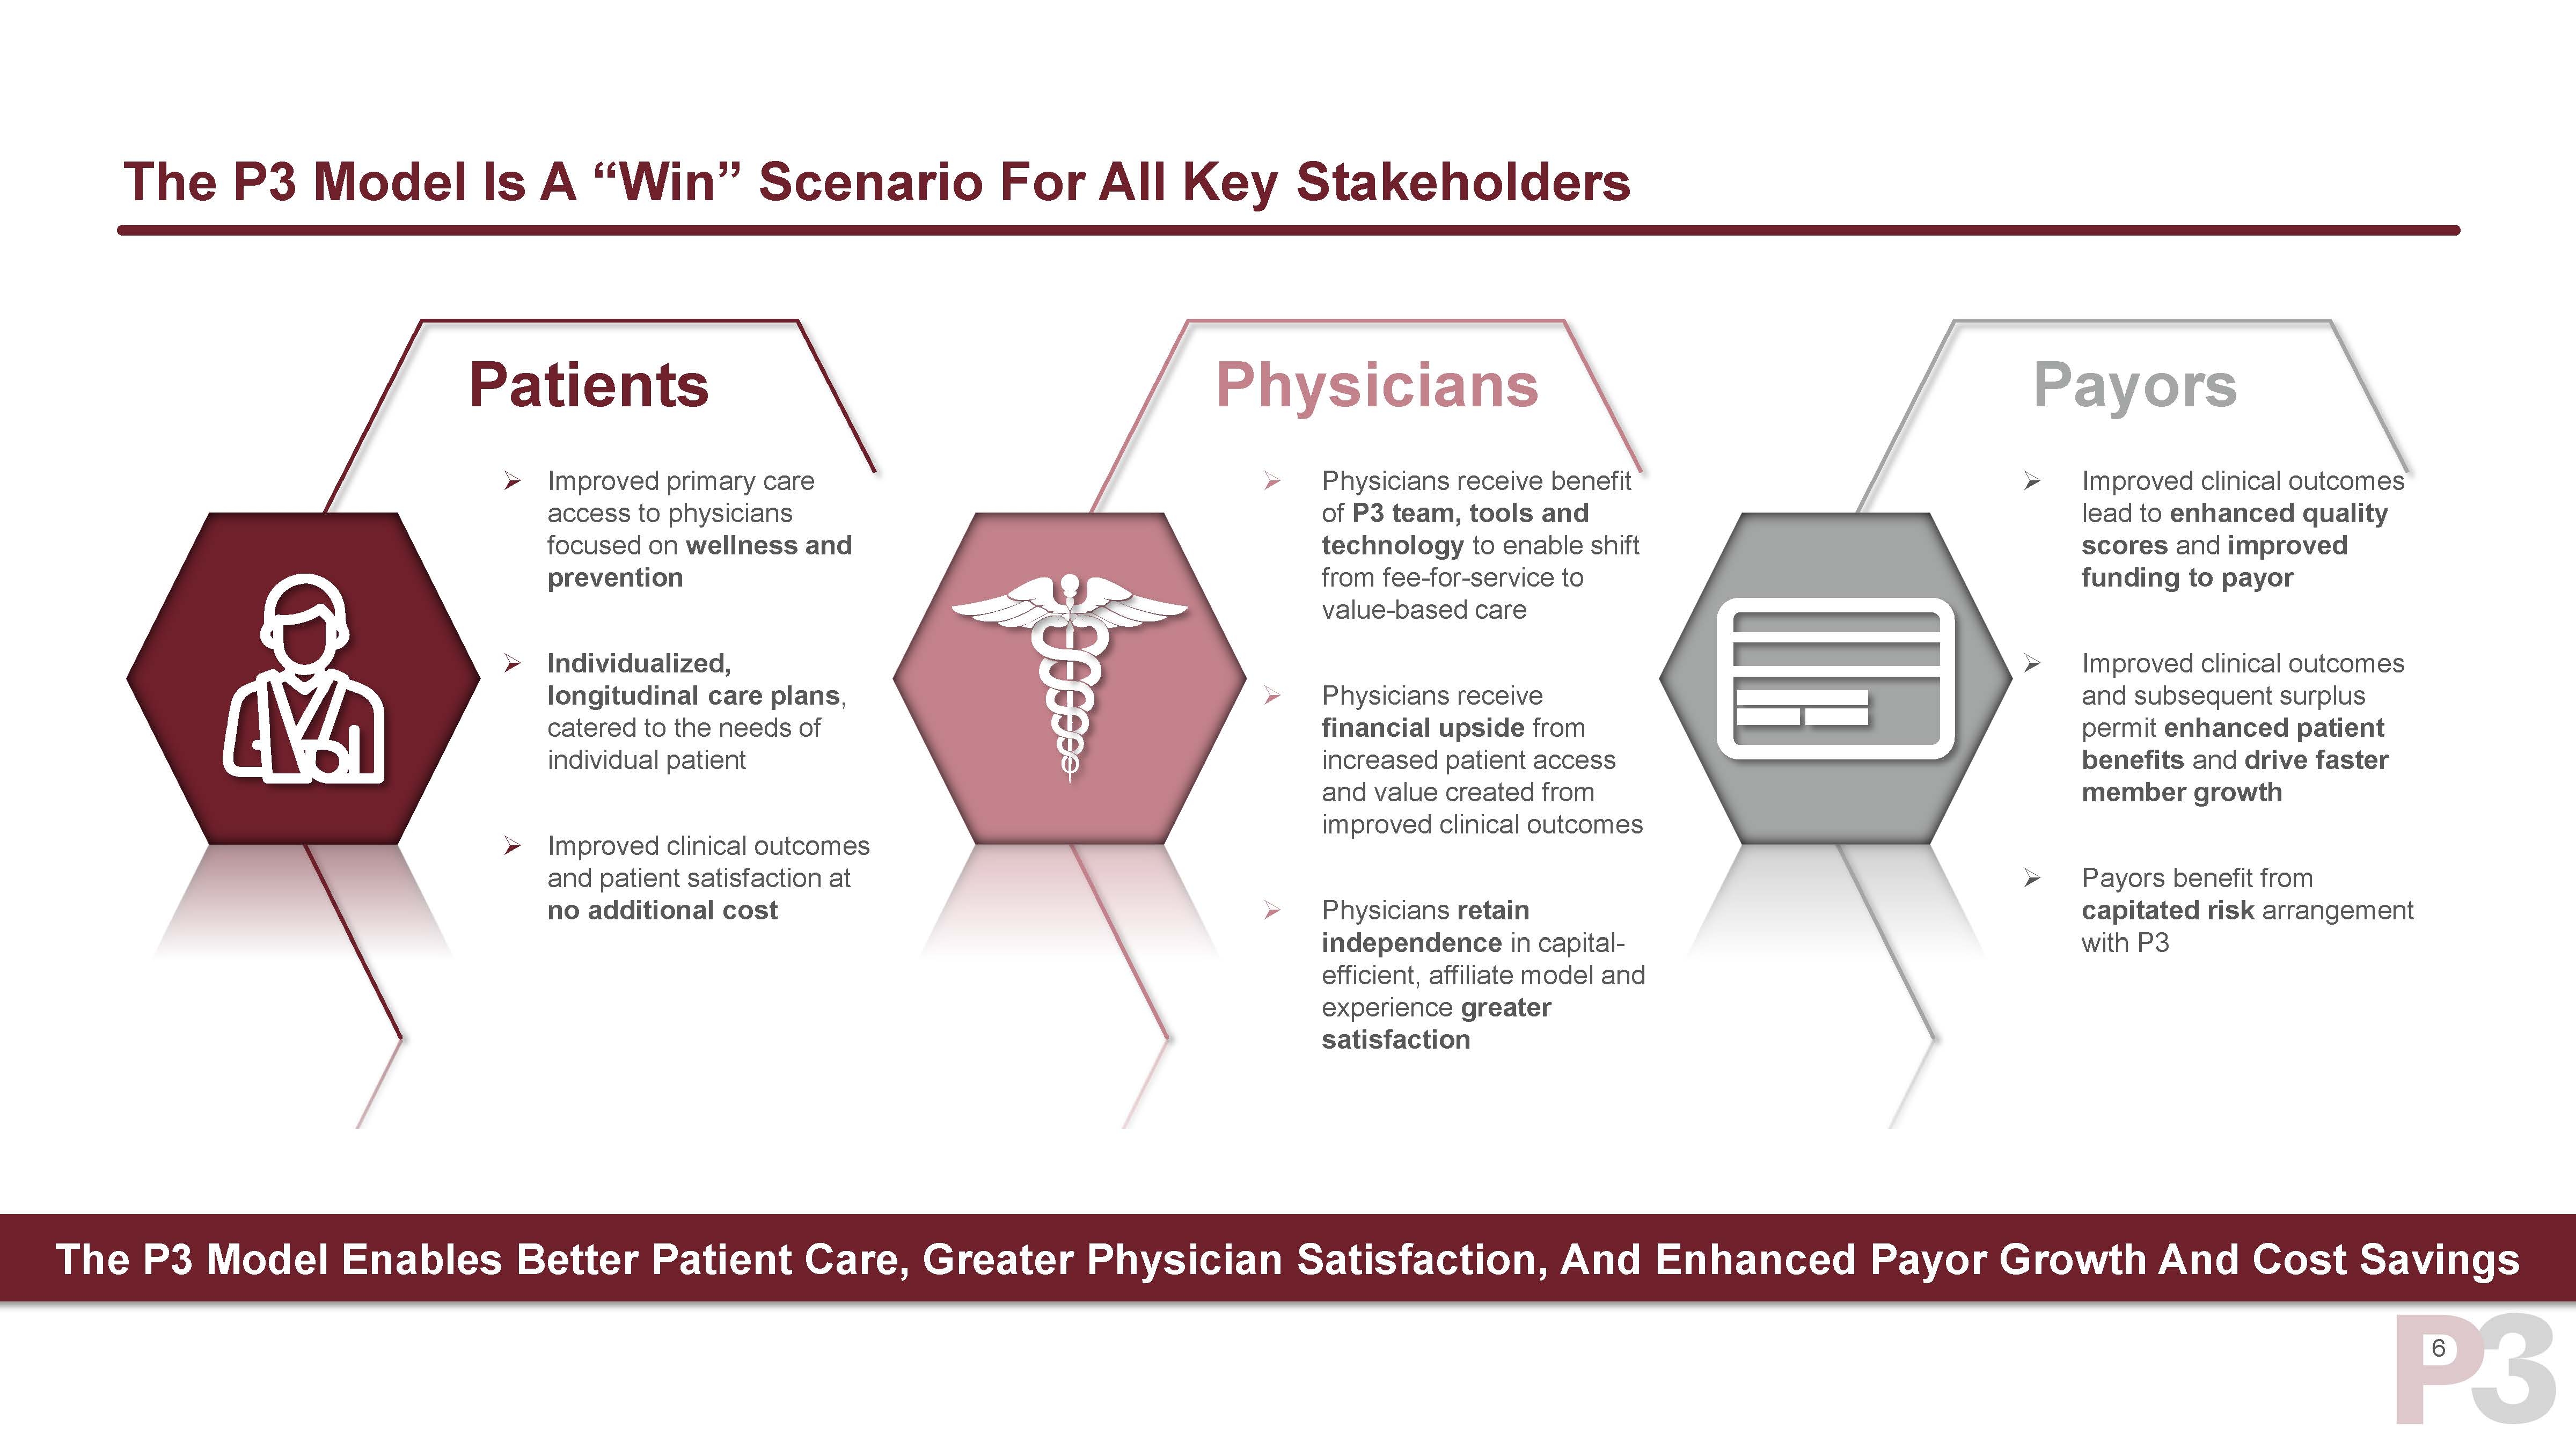
| 6 The P3 Model Is A “Win” Scenario For All Key Stakeholders Improved primary care access to physicians focused on wellness and prevention Individualized, longitudinal care plans, catered to the needs of individual patient Improved clinical outcomes and patient satisfaction at no additional cost Improved clinical outcomes lead to enhanced quality scores and improved funding to payor Improved clinical outcomes and subsequent surplus permit enhanced patient benefits and drive faster member growth Payors benefit from capitated risk arrangement with P3 Physicians receive benefit of P3 team, tools and technology to enable shift from fee-for-service to value-based care Physicians receive financial upside from increased patient access and value created from improved clinical outcomes Physicians retain independence in capital- efficient, affiliate model and experience greater satisfaction Patients Physicians Payors The P3 Model Enables Better Patient Care, Greater Physician Satisfaction, And Enhanced Payor Growth And Cost Savings |
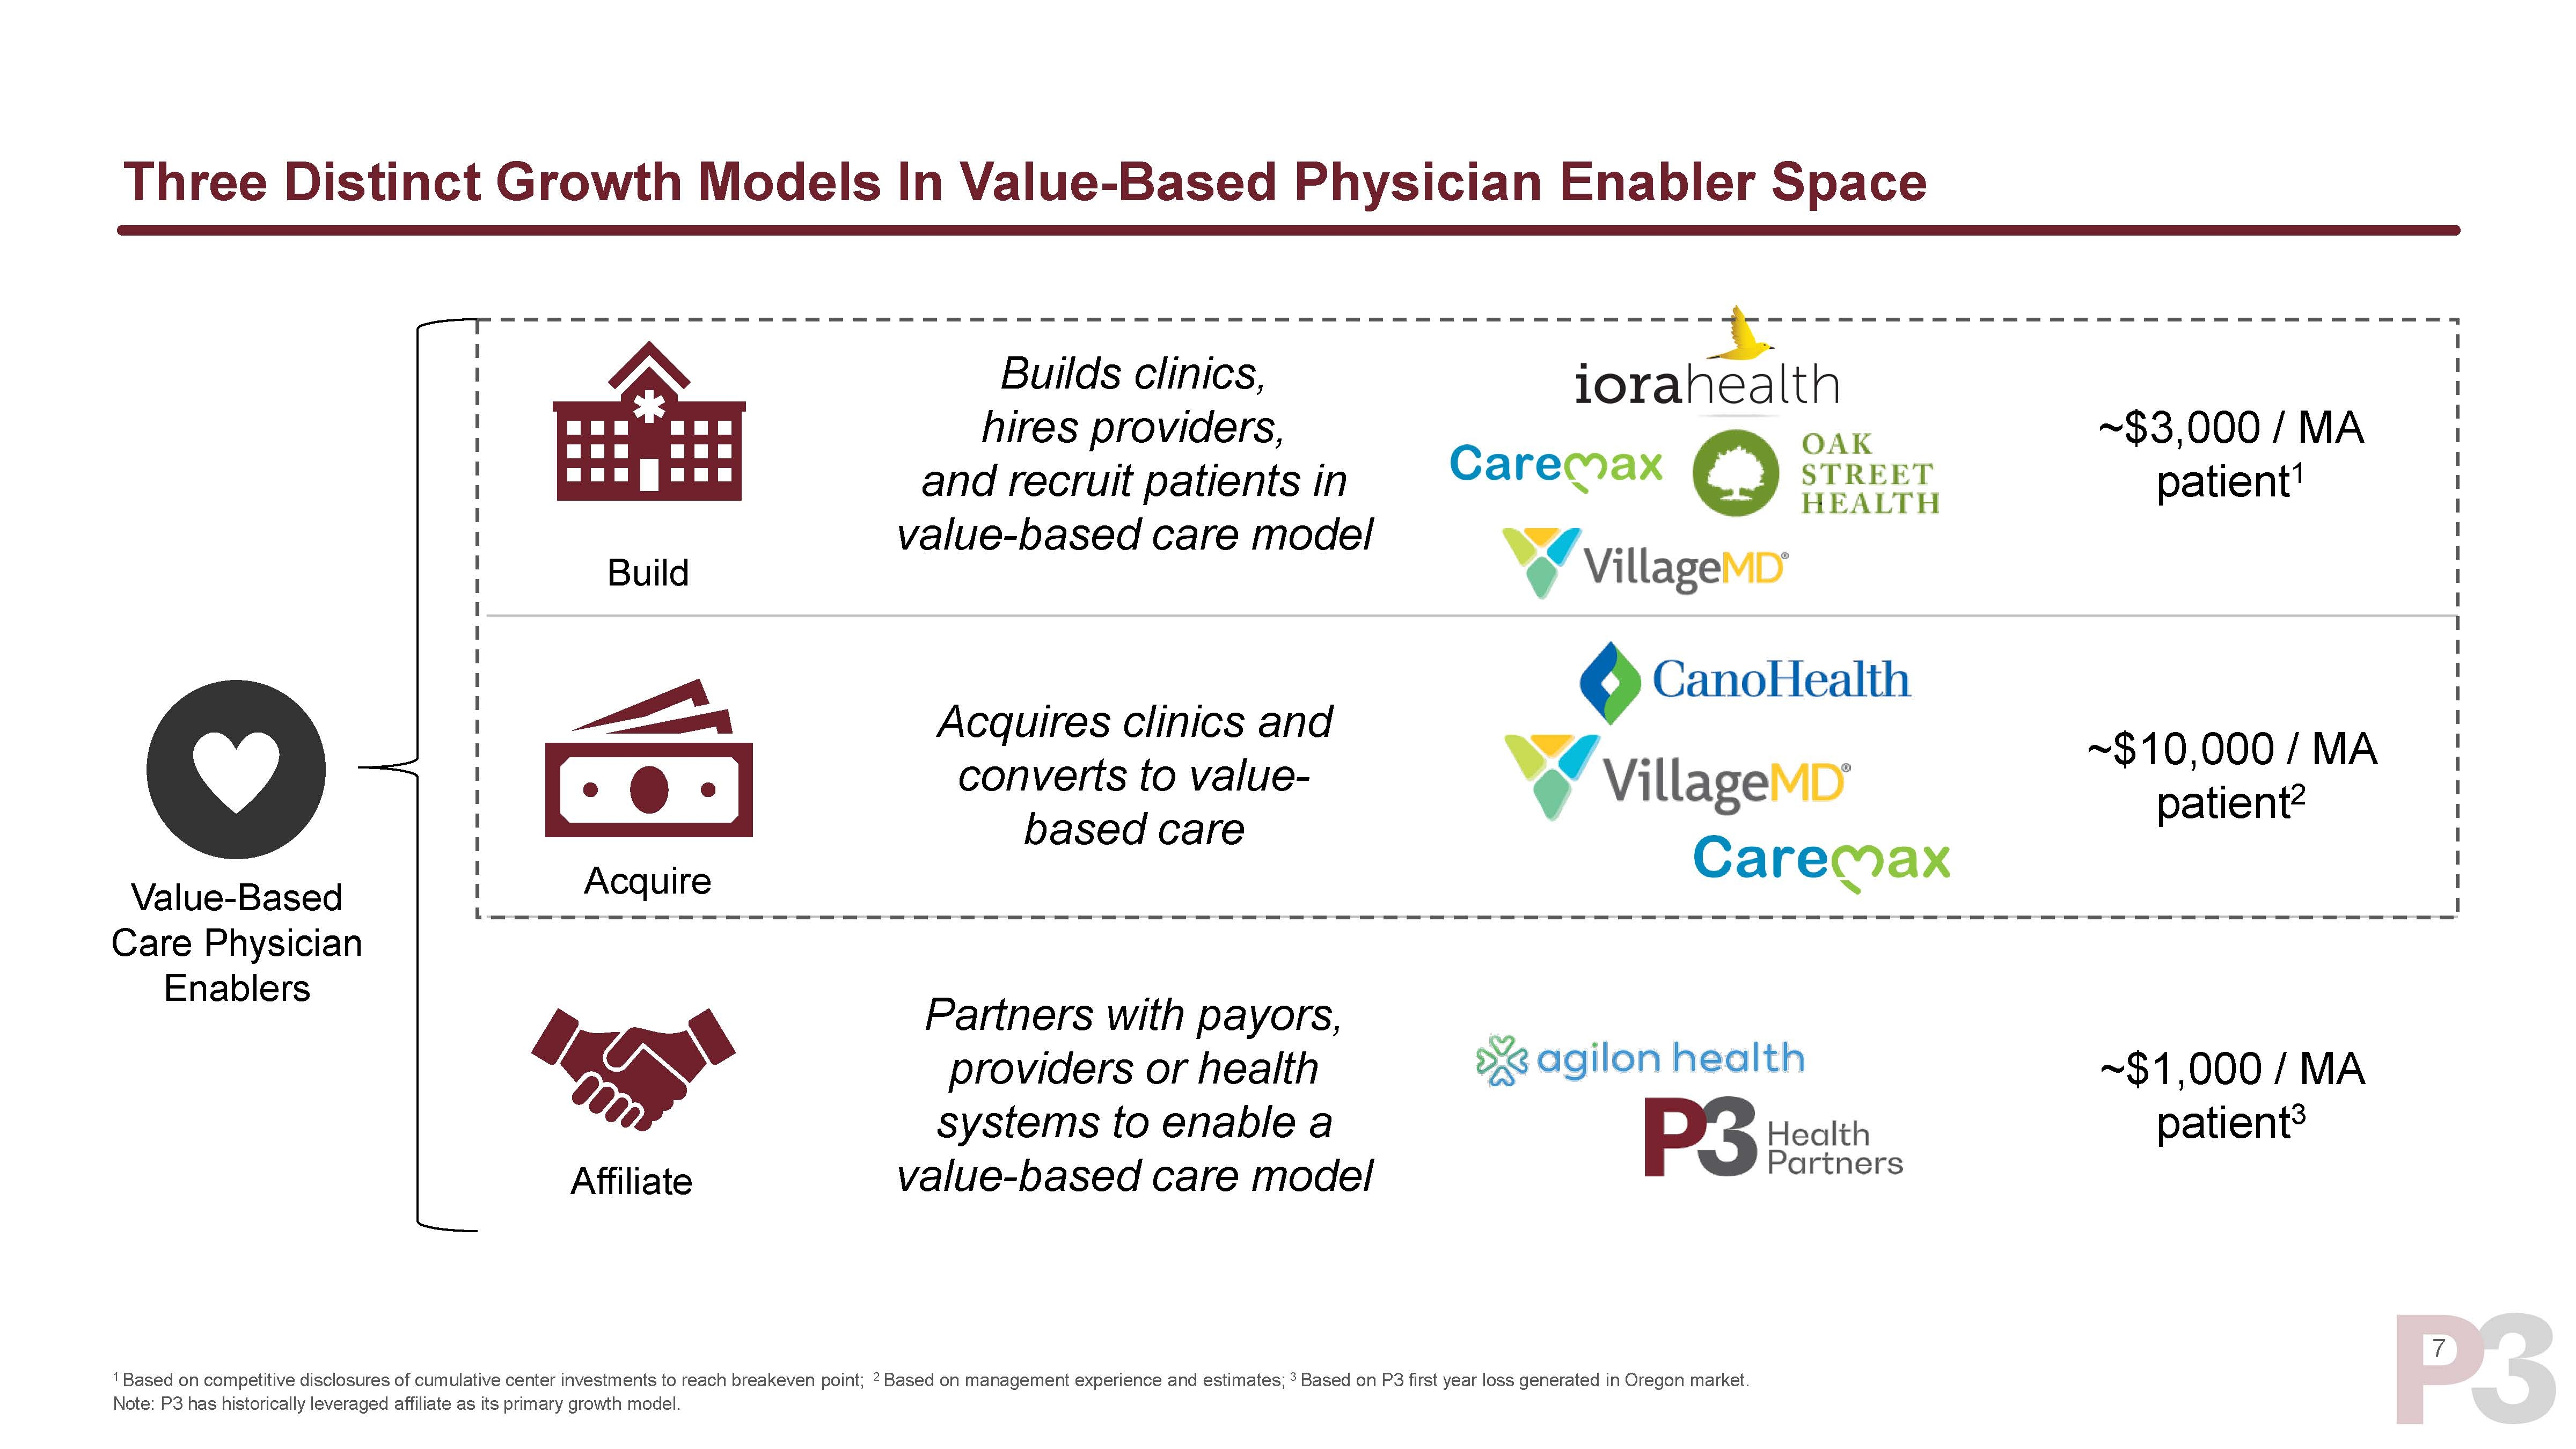
| 7 Three Distinct Growth Models In Value-Based Physician Enabler Space Builds clinics, hires providers, and recruit patients in value-based care model Build Value-Based Care Physician Enablers Partners with payors, providers or health systems to enable a value-based care model Affiliate Acquires clinics and converts to value- based care Acquire ~$3,000 / MA patient1 ~$1,000 / MA patient3 ~$10,000 / MA patient2 1 Based on competitive disclosures of cumulative center investments to reach breakeven point; 2 Based on management experience and estimates; 3 Based on P3 first year loss generated in Oregon market. Note: P3 has historically leveraged affiliate as its primary growth model. |
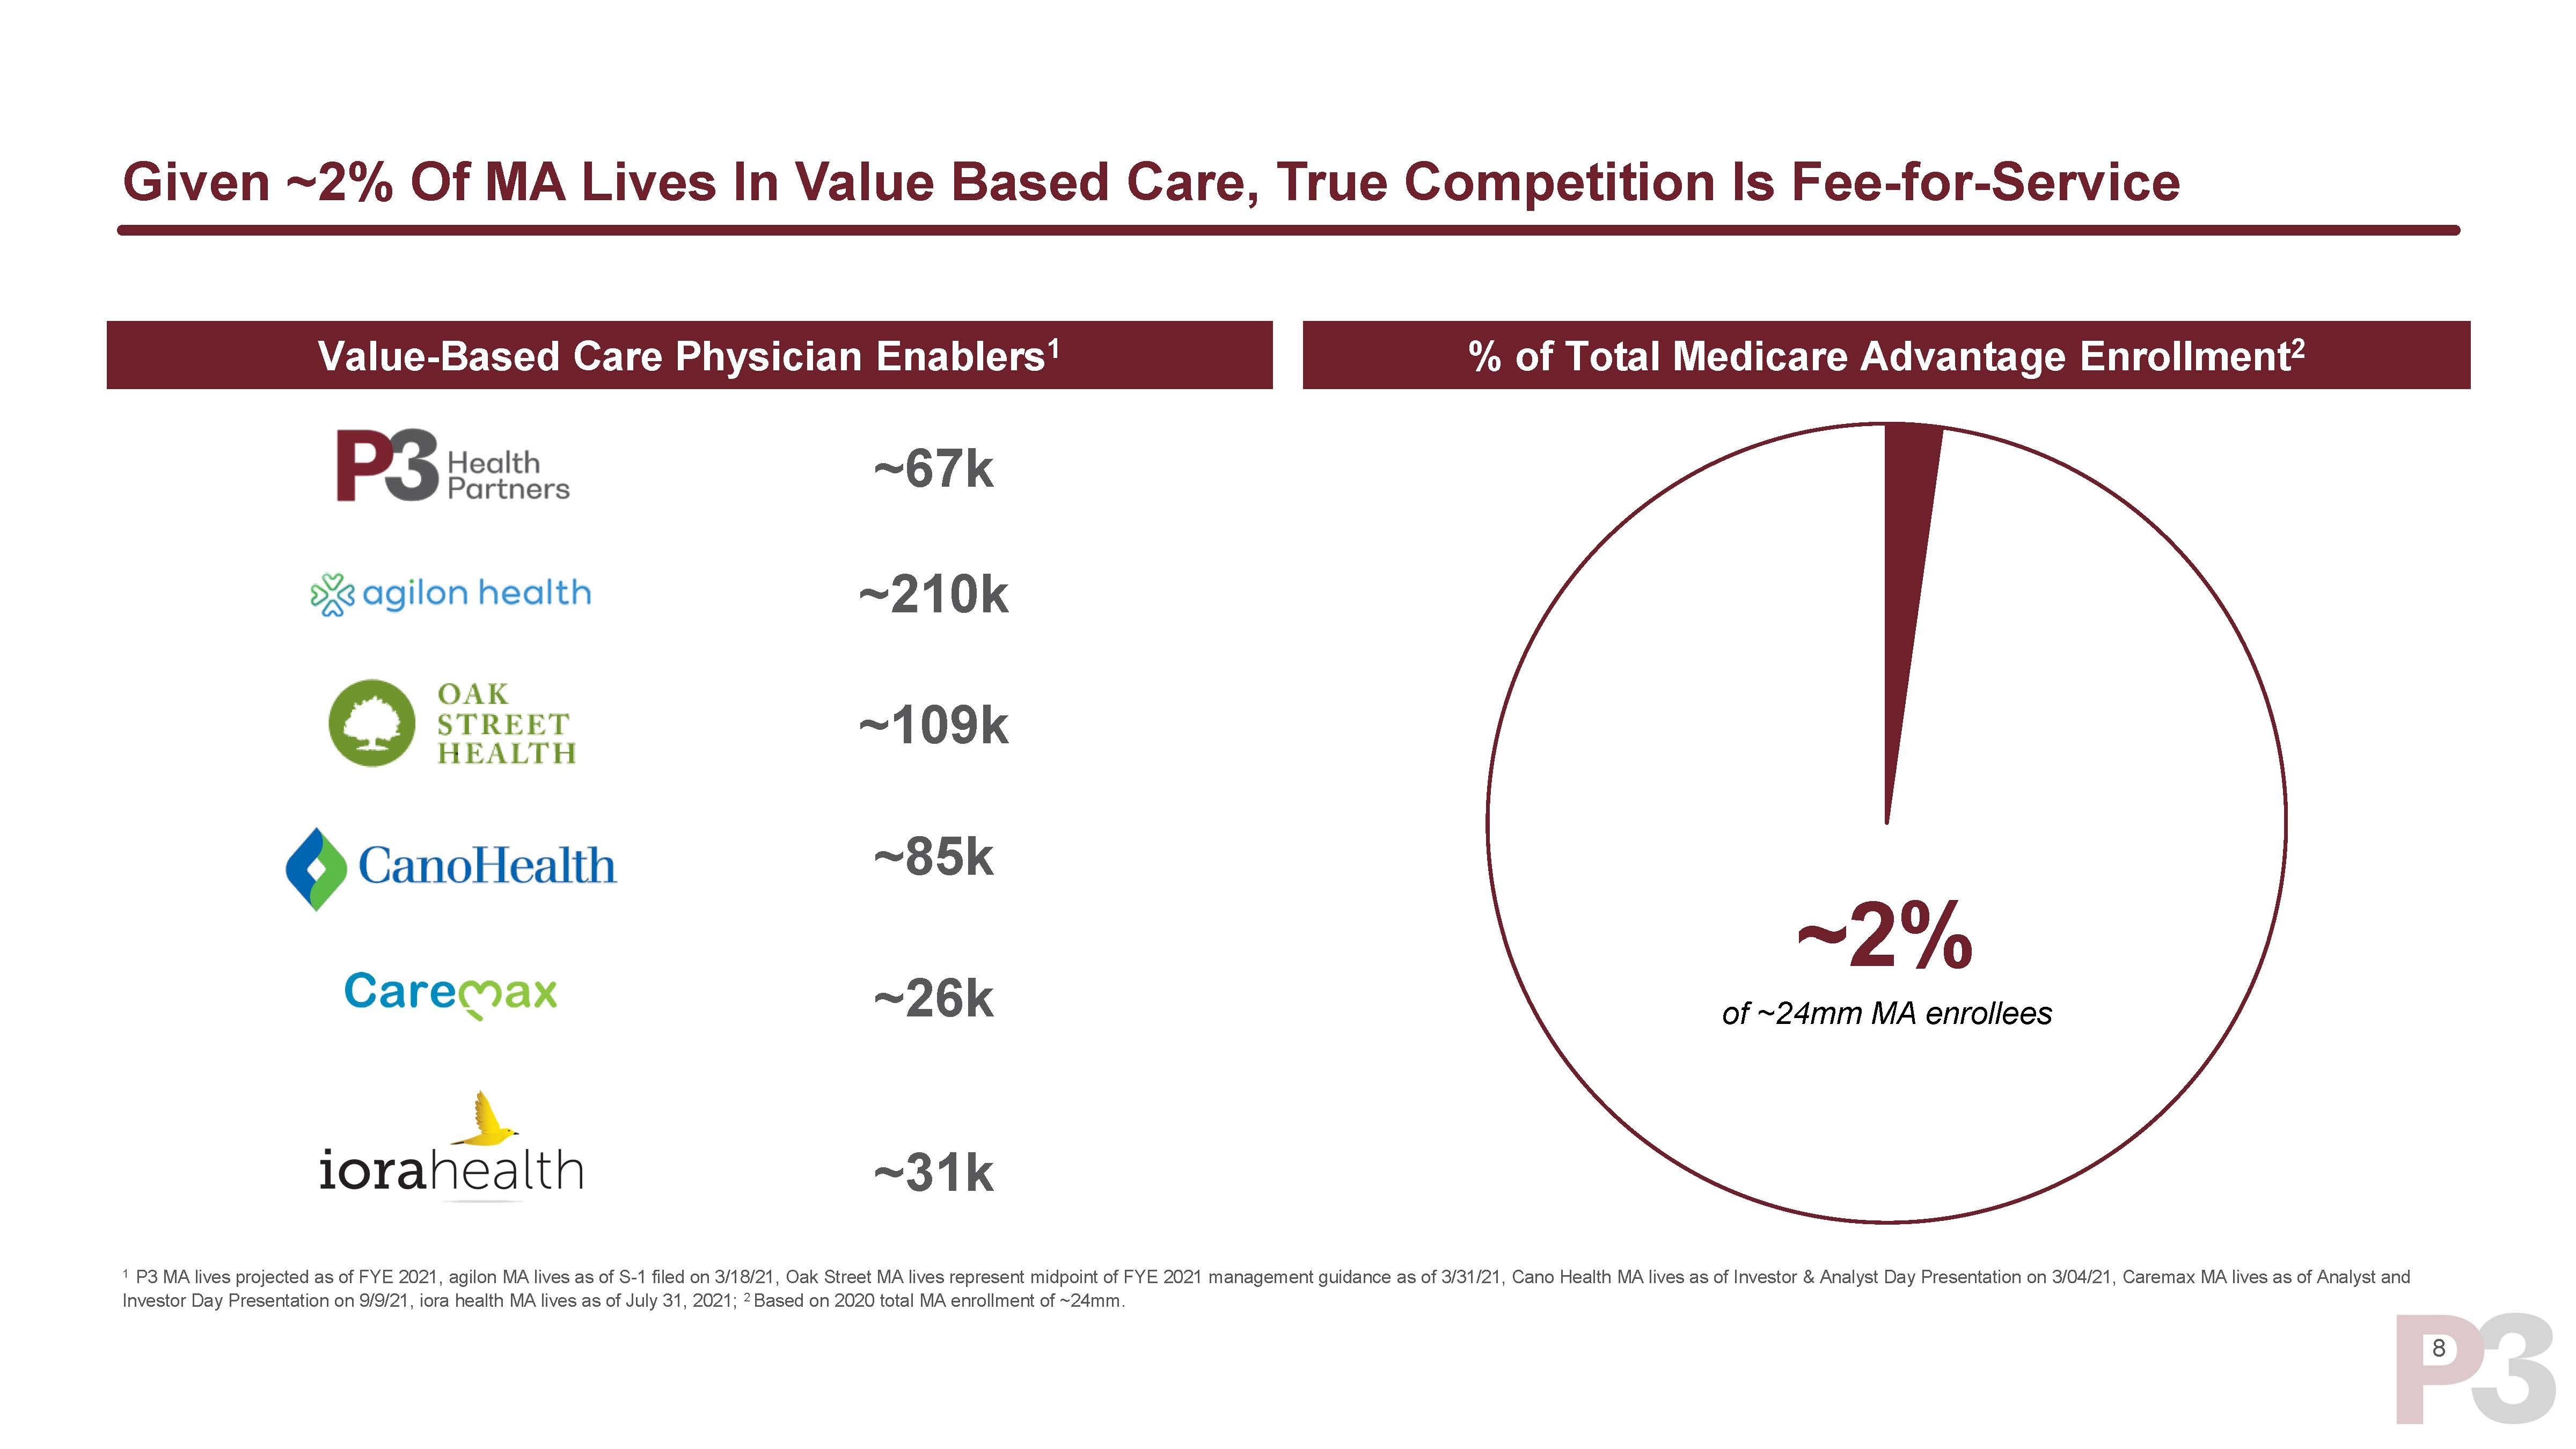
| 8 Given ~2% Of MA Lives In Value Based Care, True Competition Is Fee-for-Service 1 P3 MA lives projected as of FYE 2021, agilon MA lives as of S-1 filed on 3/18/21, Oak Street MA lives represent midpoint of FYE 2021 management guidance as of 3/31/21, Cano Health MA lives as of Investor & Analyst Day Presentation on 3/04/21, Caremax MA lives as of Analyst and Investor Day Presentation on 9/9/21, iora health MA lives as of July 31, 2021; 2 Based on 2020 total MA enrollment of ~24mm. Value-Based Care Physician Enablers1 ~67k ~210k ~109k ~85k ~31k ~26k % of Total Medicare Advantage Enrollment2 ~2% of ~24mm MA enrollees |
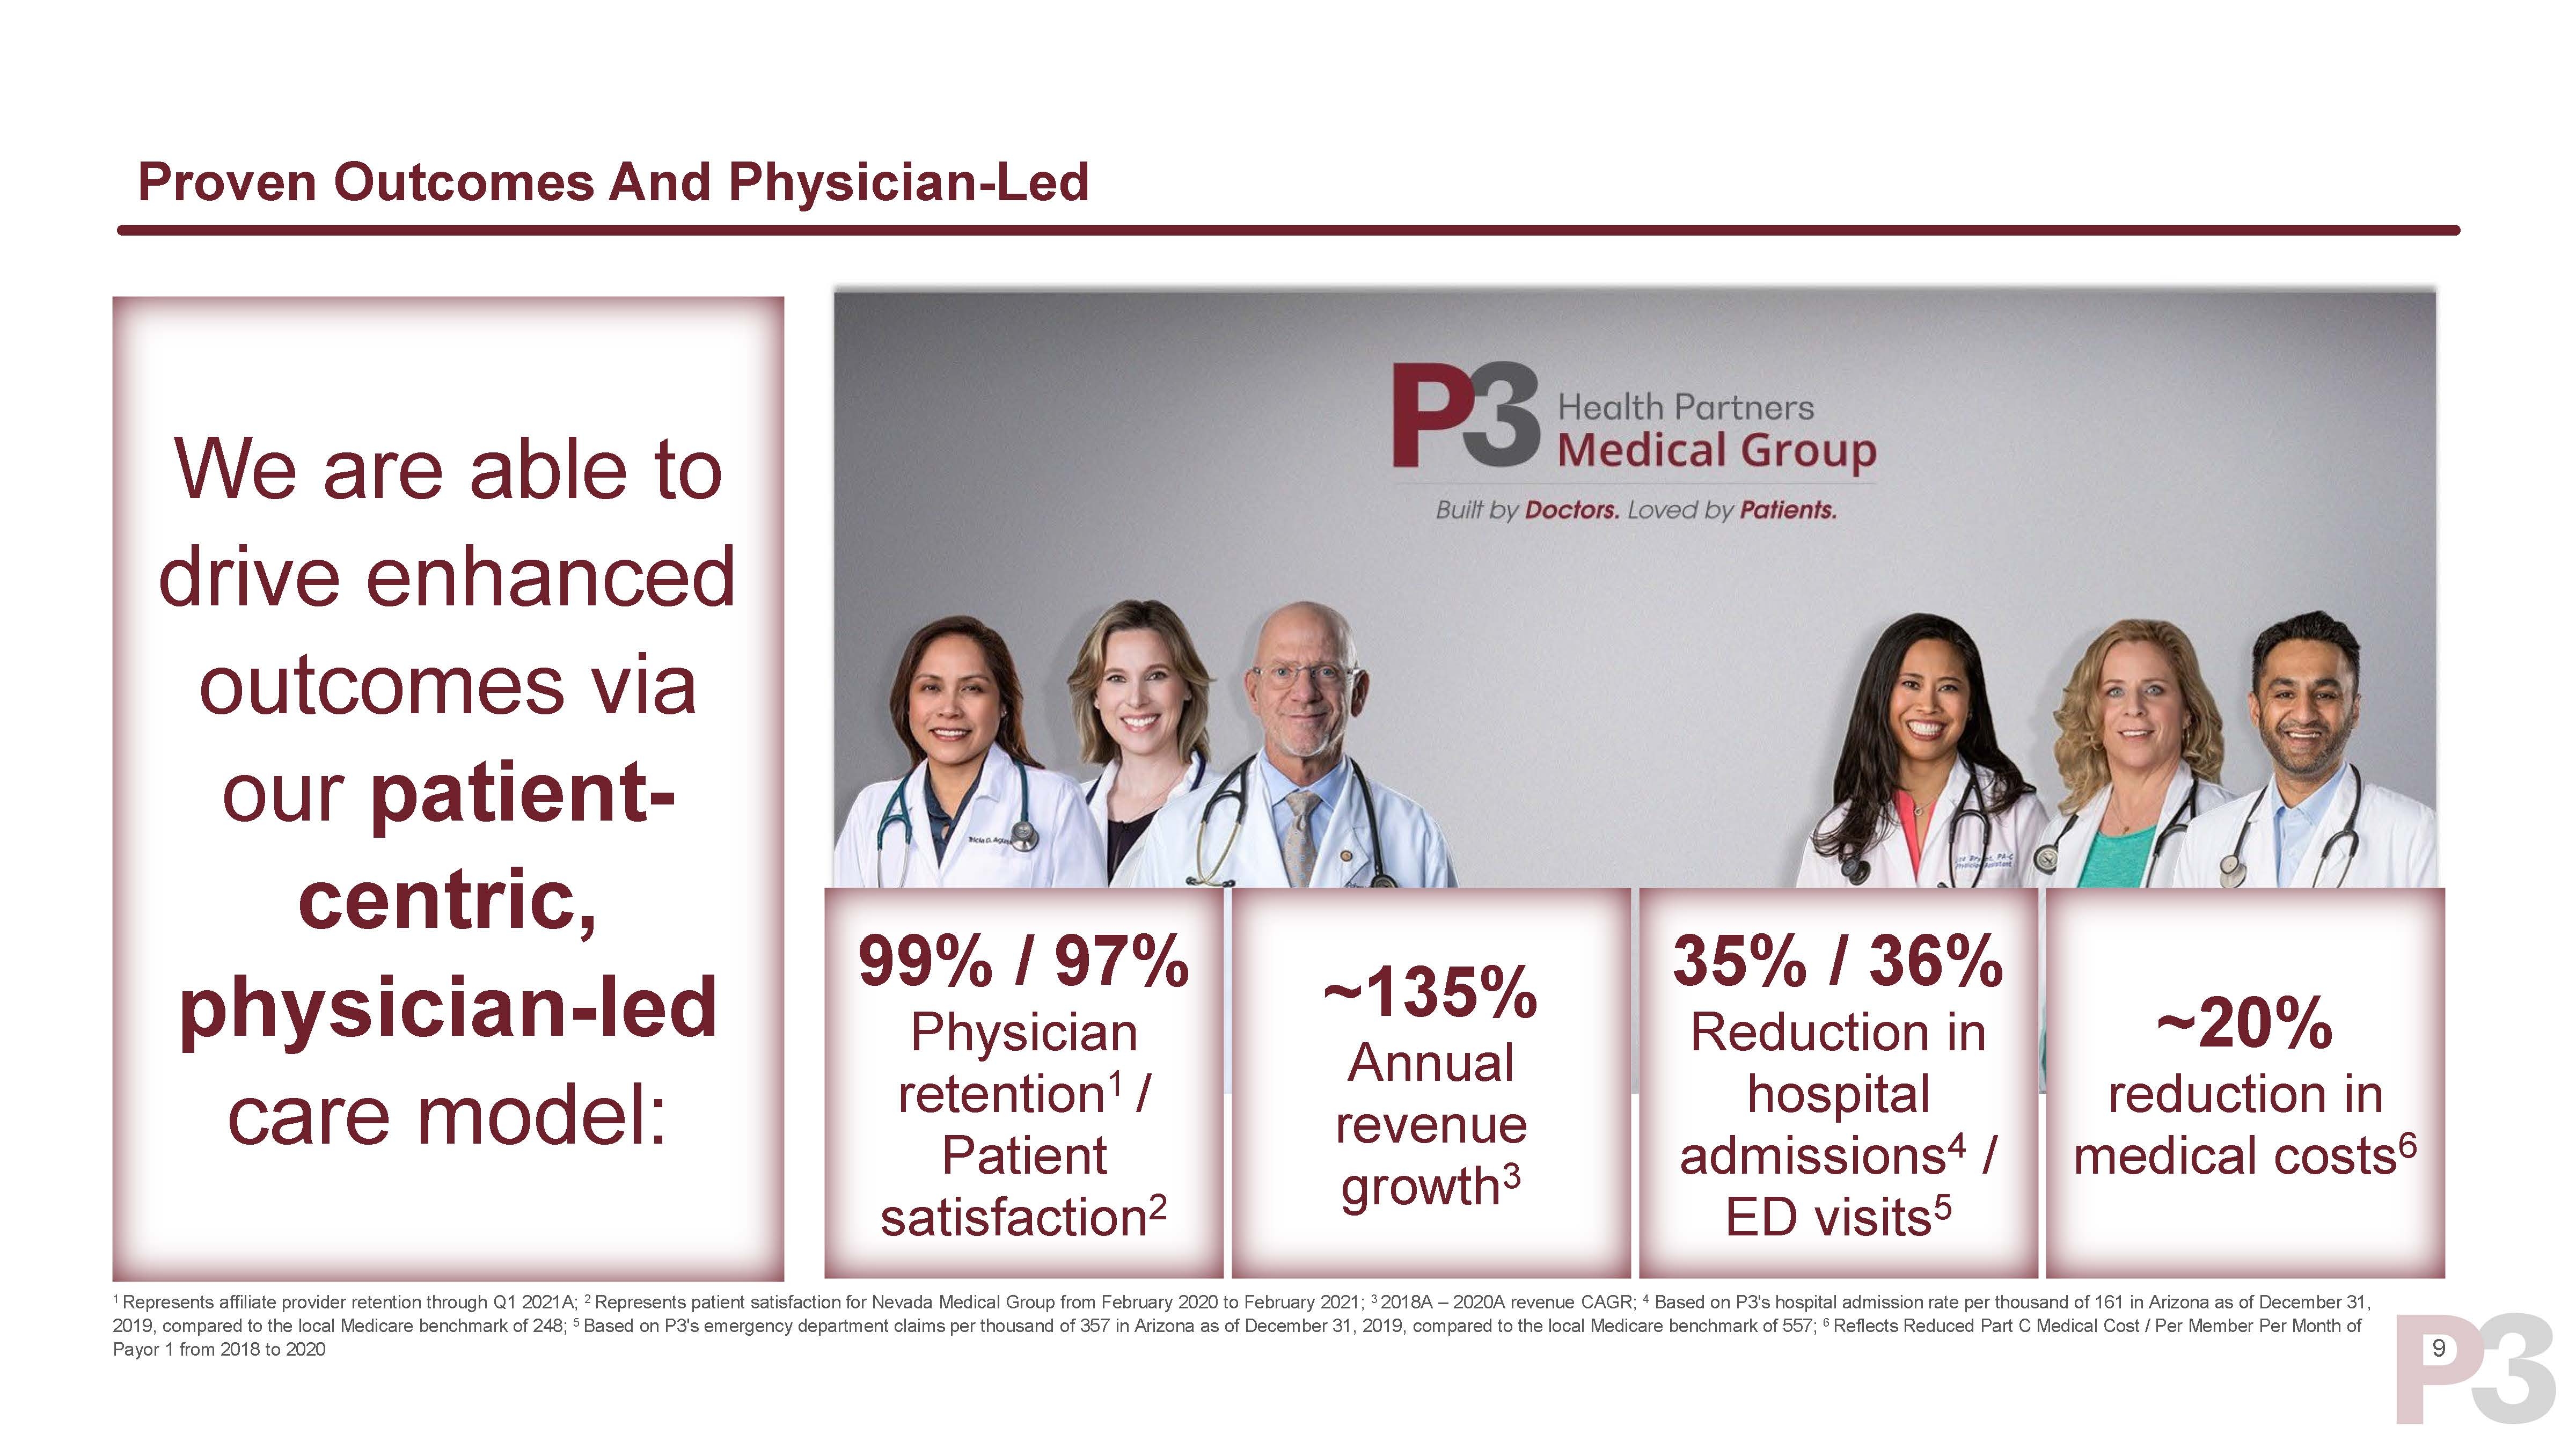
| 9 Proven Outcomes And Physician-Led We are able to drive enhanced outcomes via our patient- centric, physician-led care model: 35% / 36% Reduction in hospital admissions4 / ED visits5 1 Represents affiliate provider retention through Q1 2021A; 2 Represents patient satisfaction for Nevada Medical Group from February 2020 to February 2021; 3 2018A – 2020A revenue CAGR; 4 Based on P3's hospital admission rate per thousand of 161 in Arizona as of December 31, 2019, compared to the local Medicare benchmark of 248; 5 Based on P3's emergency department claims per thousand of 357 in Arizona as of December 31, 2019, compared to the local Medicare benchmark of 557; 6 Reflects Reduced Part C Medical Cost / Per Member Per Month of Payor 1 from 2018 to 2020 ~20% reduction in medical costs6 99% / 97% Physician retention1 / Patient satisfaction2 ~135% Annual revenue growth3 |
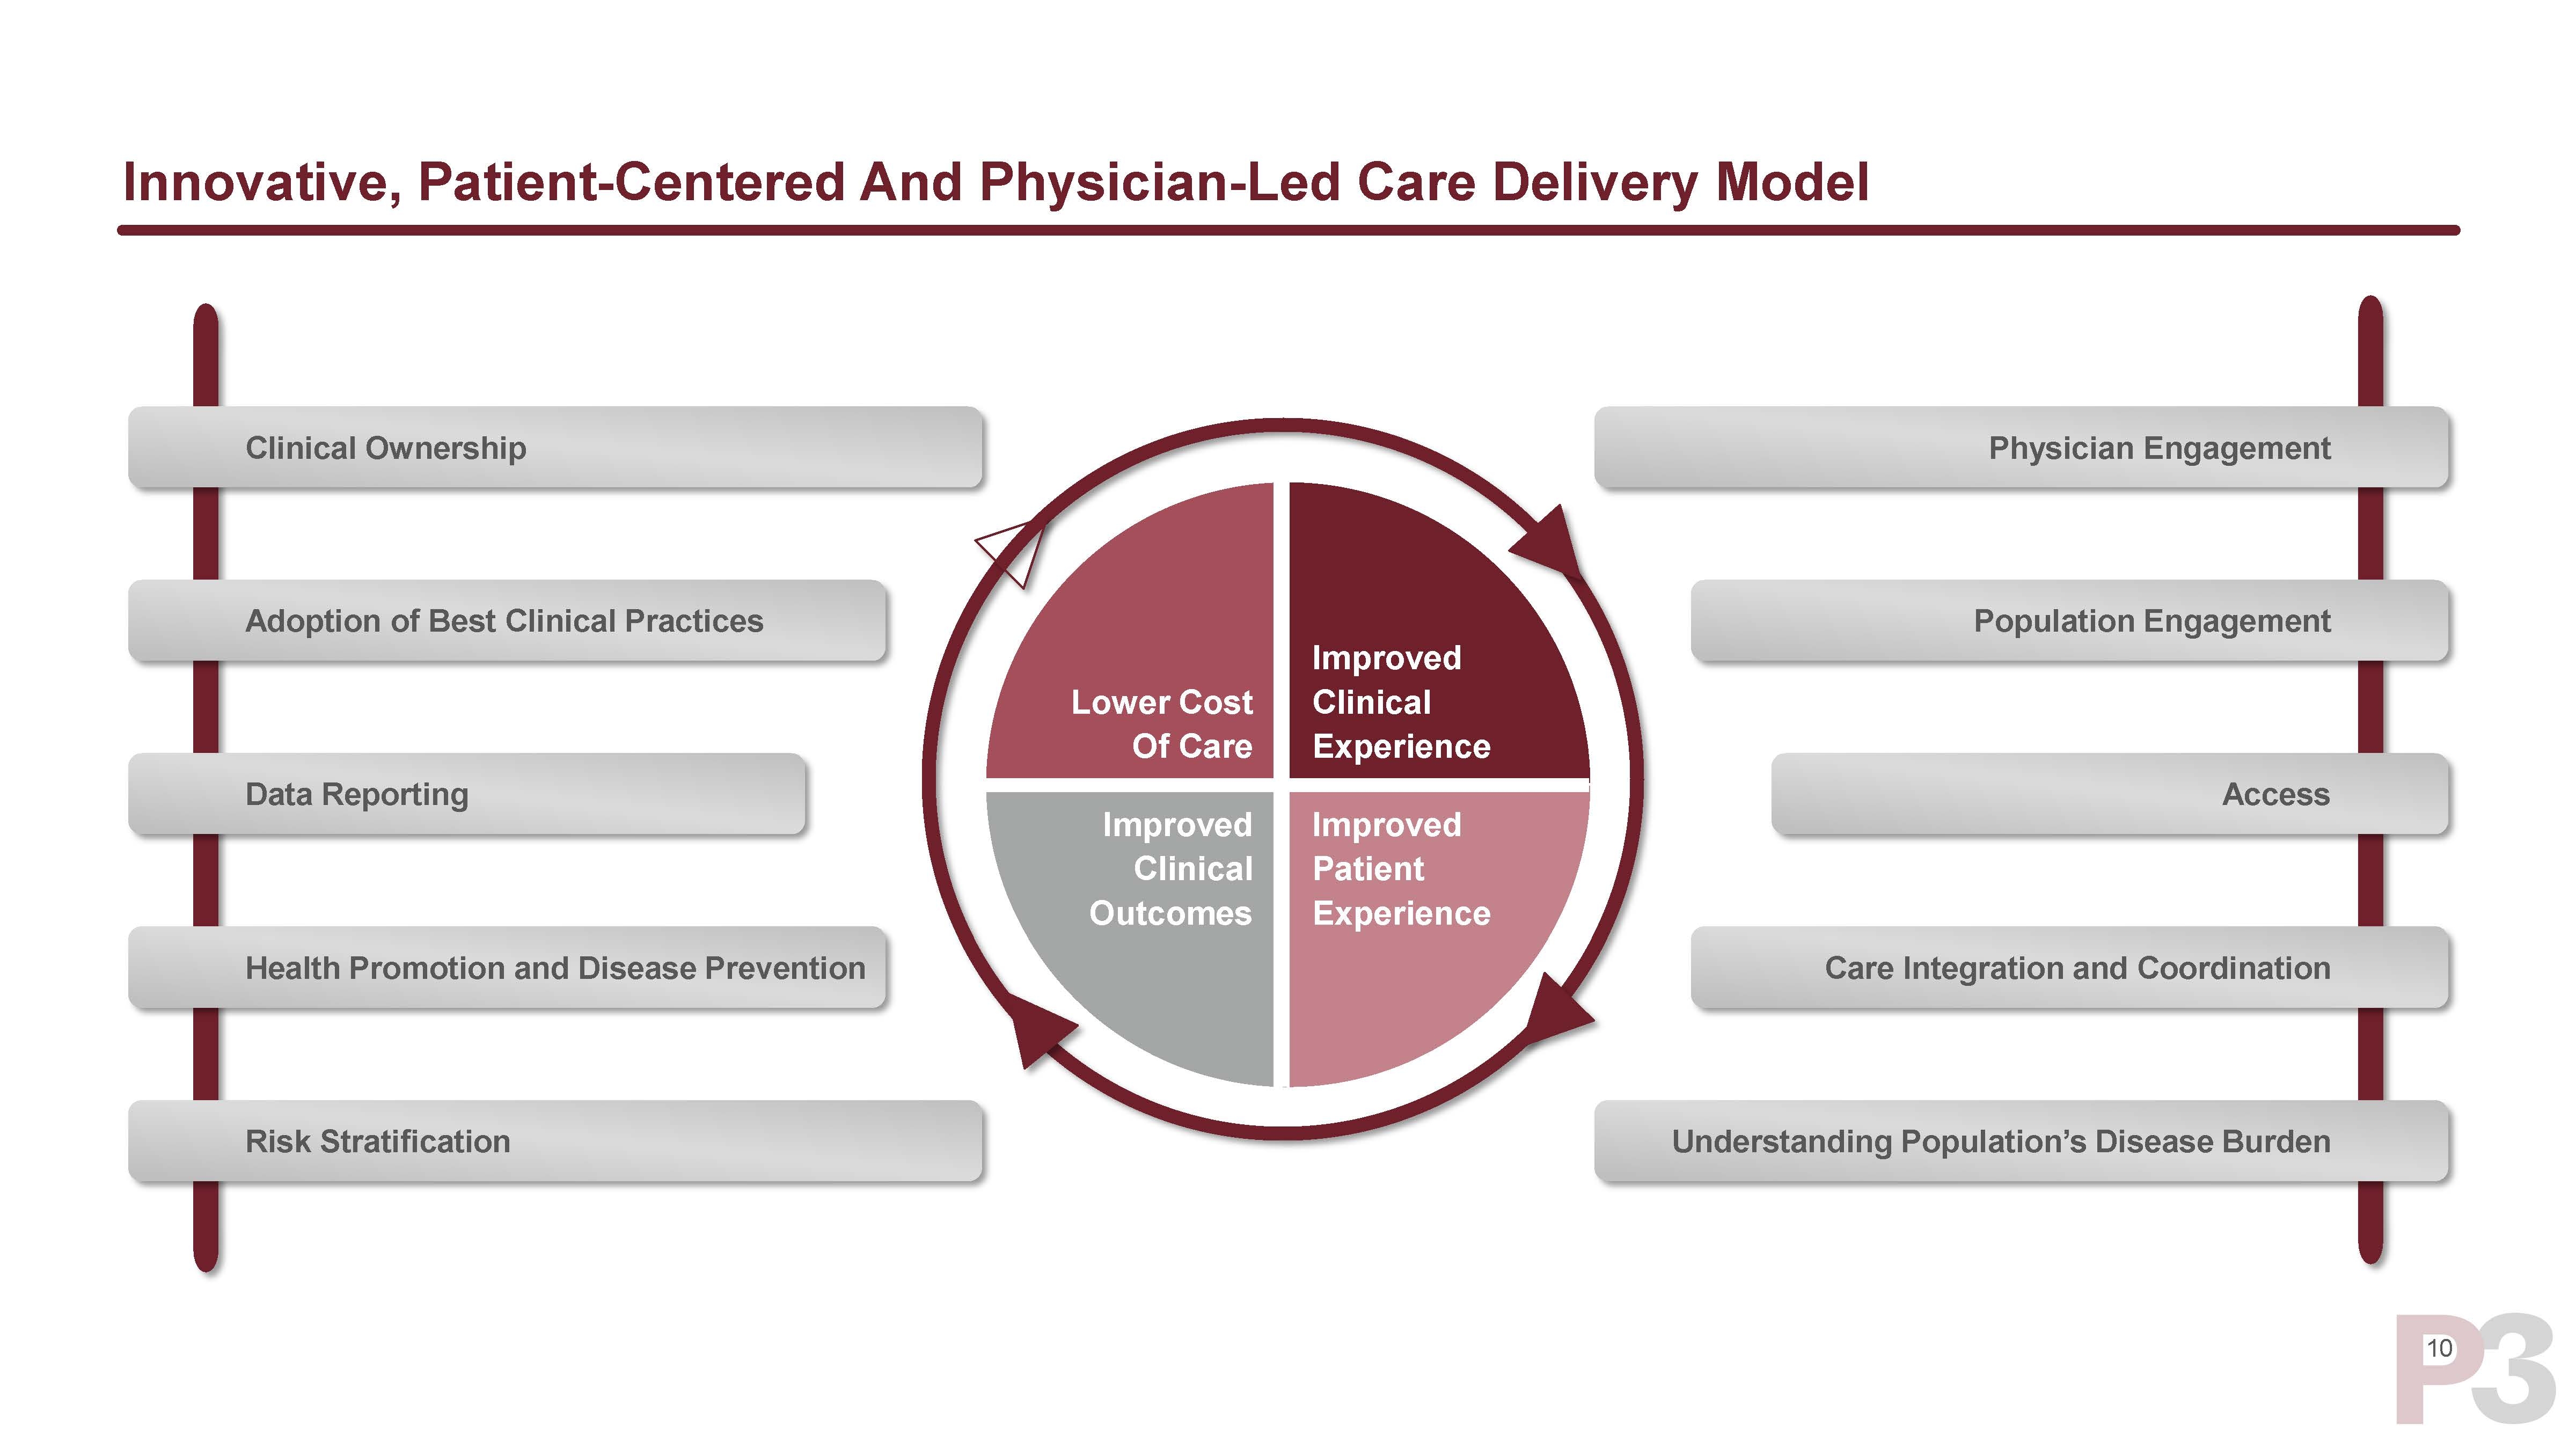
| 10 Innovative, Patient-Centered And Physician-Led Care Delivery Model Physician Engagement Clinical Ownership Population Engagement Access Adoption of Best Clinical Practices Data Reporting Health Promotion and Disease Prevention Risk Stratification Understanding Population’s Disease Burden Care Integration and Coordination Improved Clinical Experience Lower Cost Of Care Improved Clinical Outcomes Improved Patient Experience |
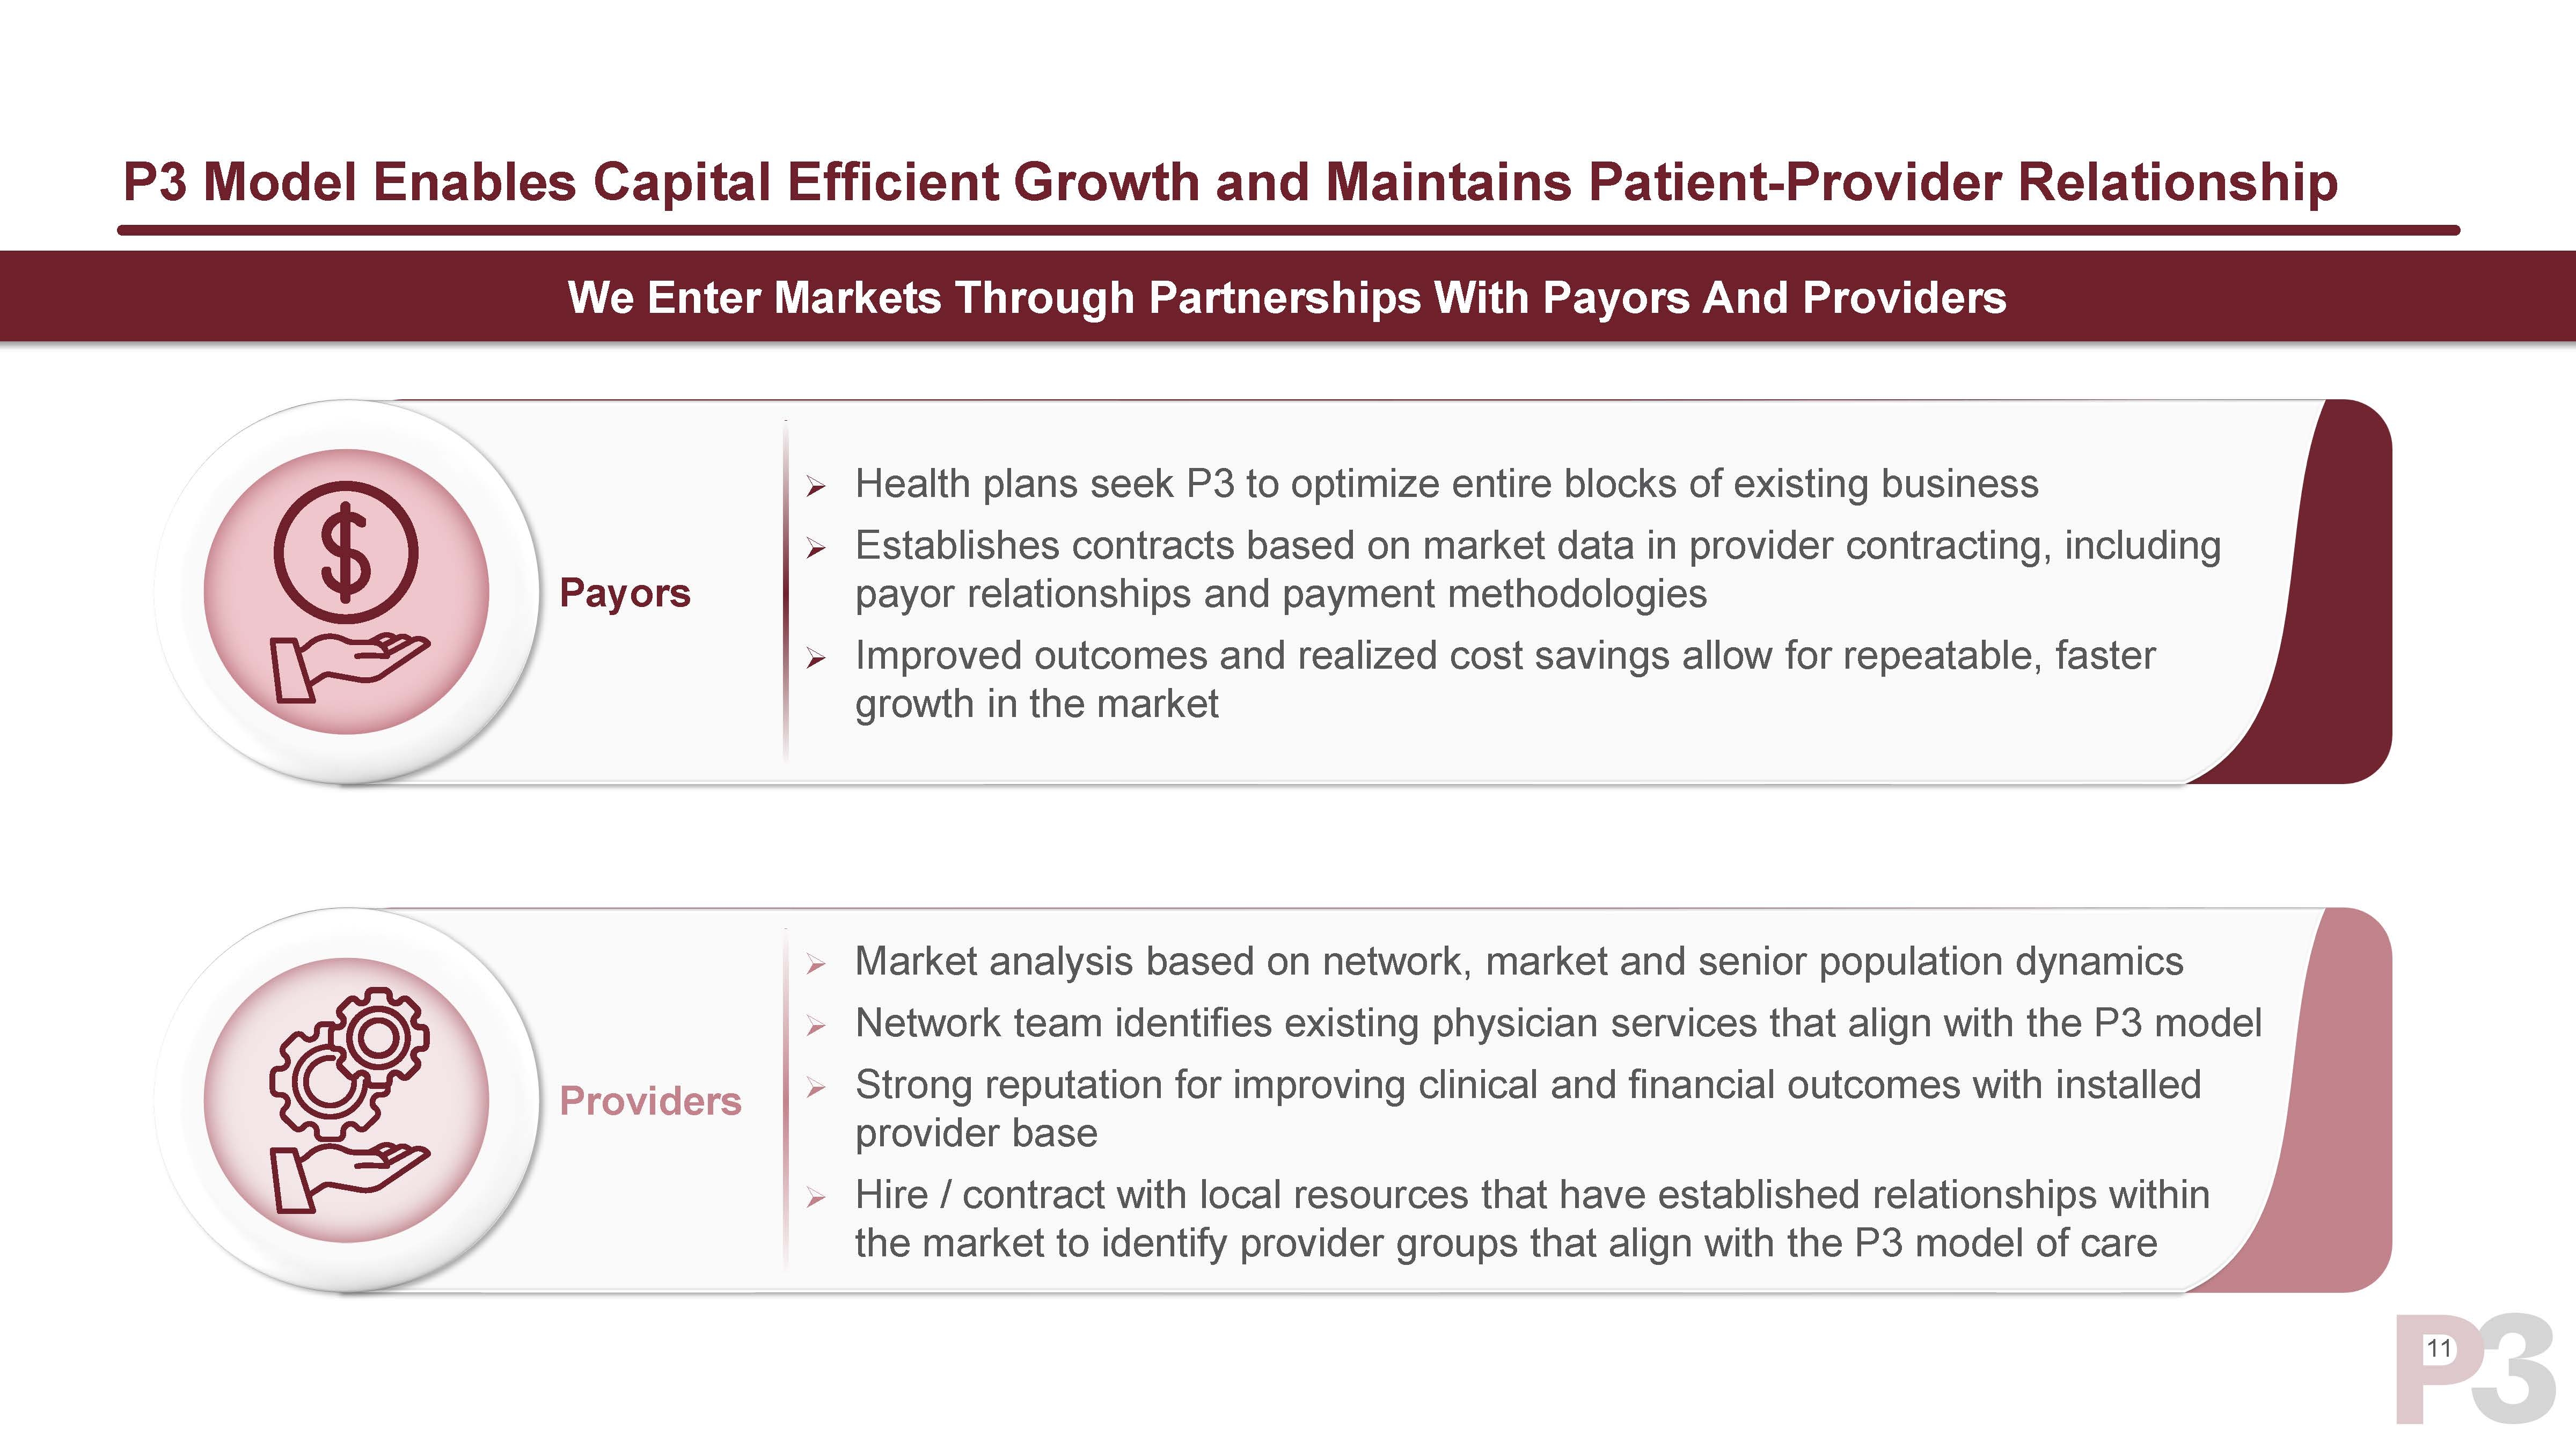
| 11 P3 Model Enables Capital Efficient Growth and Maintains Patient-Provider Relationship Market Entry Decisions Are Informed By Provider And Payor Data, Thereby Avoiding Large Upfront Costs Providers Payors Market analysis based on network, market and senior population dynamics Network team identifies existing physician services that align with the P3 model Strong reputation for improving clinical and financial outcomes with installed provider base Hire / contract with local resources that have established relationships within the market to identify provider groups that align with the P3 model of care Health plans seek P3 to optimize entire blocks of existing business Establishes contracts based on market data in provider contracting, including payor relationships and payment methodologies Improved outcomes and realized cost savings allow for repeatable, faster growth in the market We Enter Markets Through Partnerships With Payors And Providers |
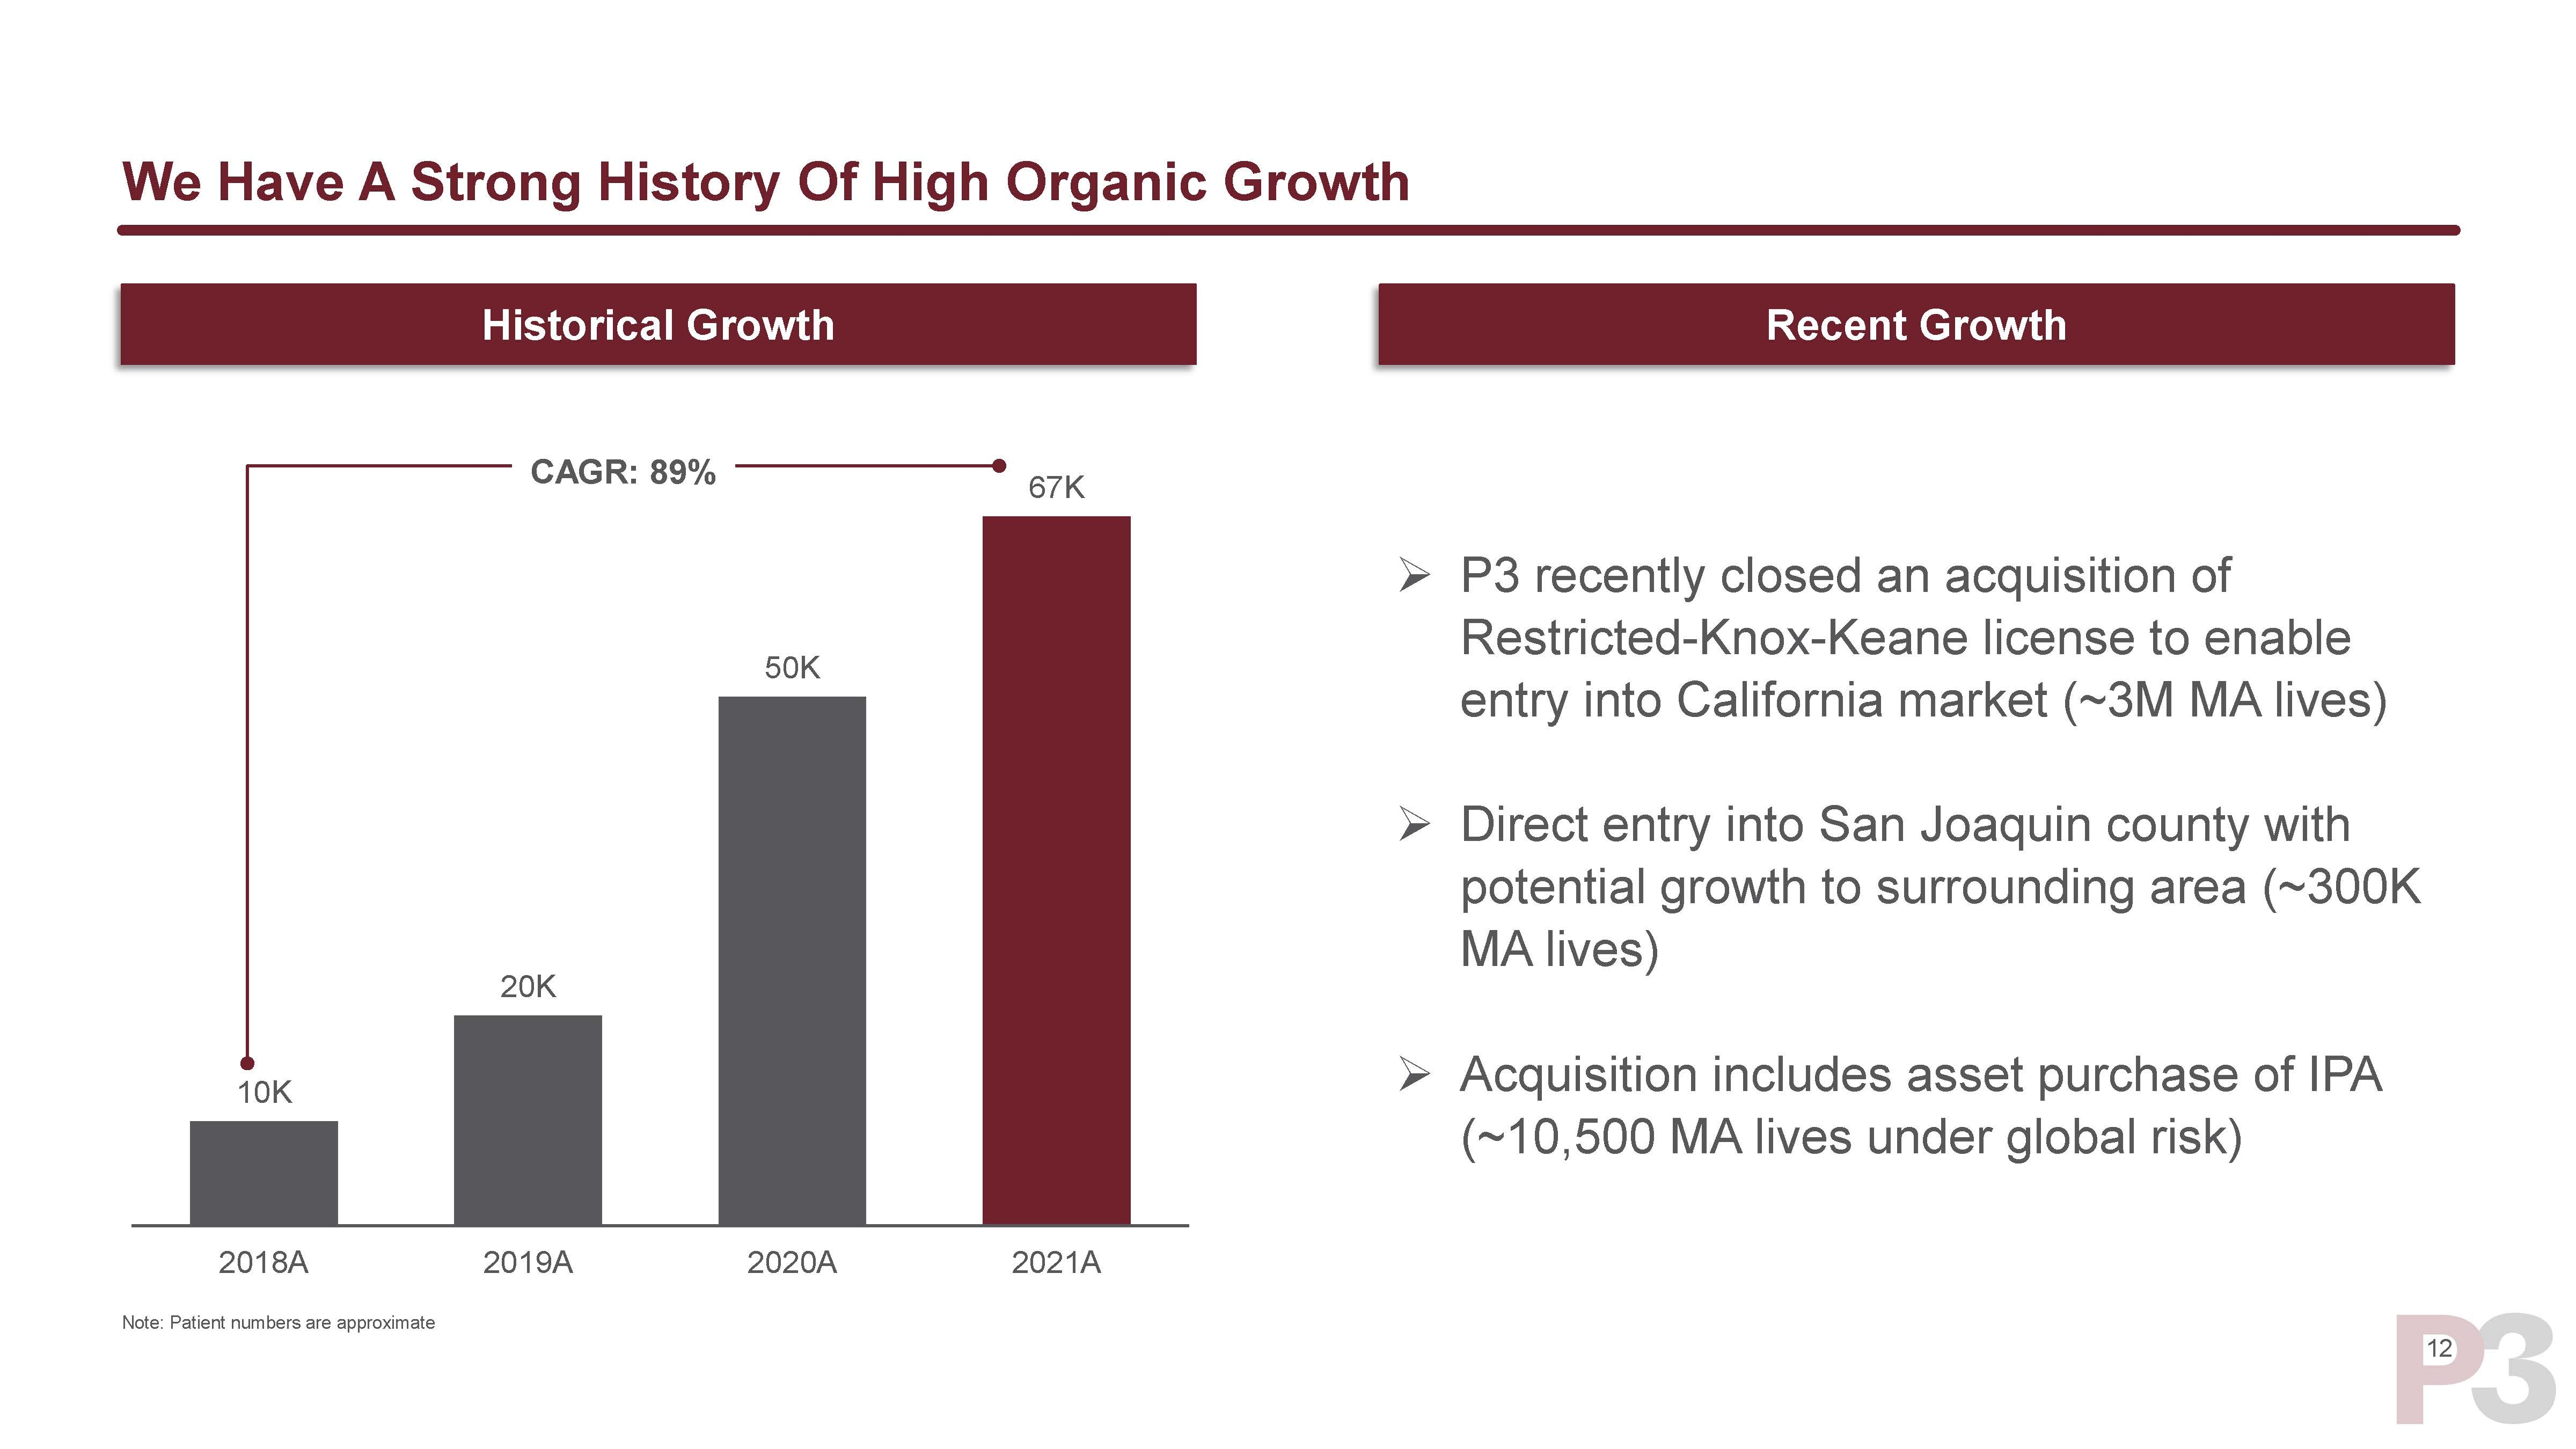
| 12 We Have A Strong History Of High Organic Growth 10K 20K 50K 67K 2018A 2019A 2020A 2021A Historical Growth CAGR: 89% Recent Growth Note: Patient numbers are approximate P3 recently closed an acquisition of Restricted-Knox-Keane license to enable entry into California market (~3M MA lives) Direct entry into San Joaquin county with potential growth to surrounding area (~300K MA lives) Acquisition includes asset purchase of IPA (~10,500 MA lives under global risk) |
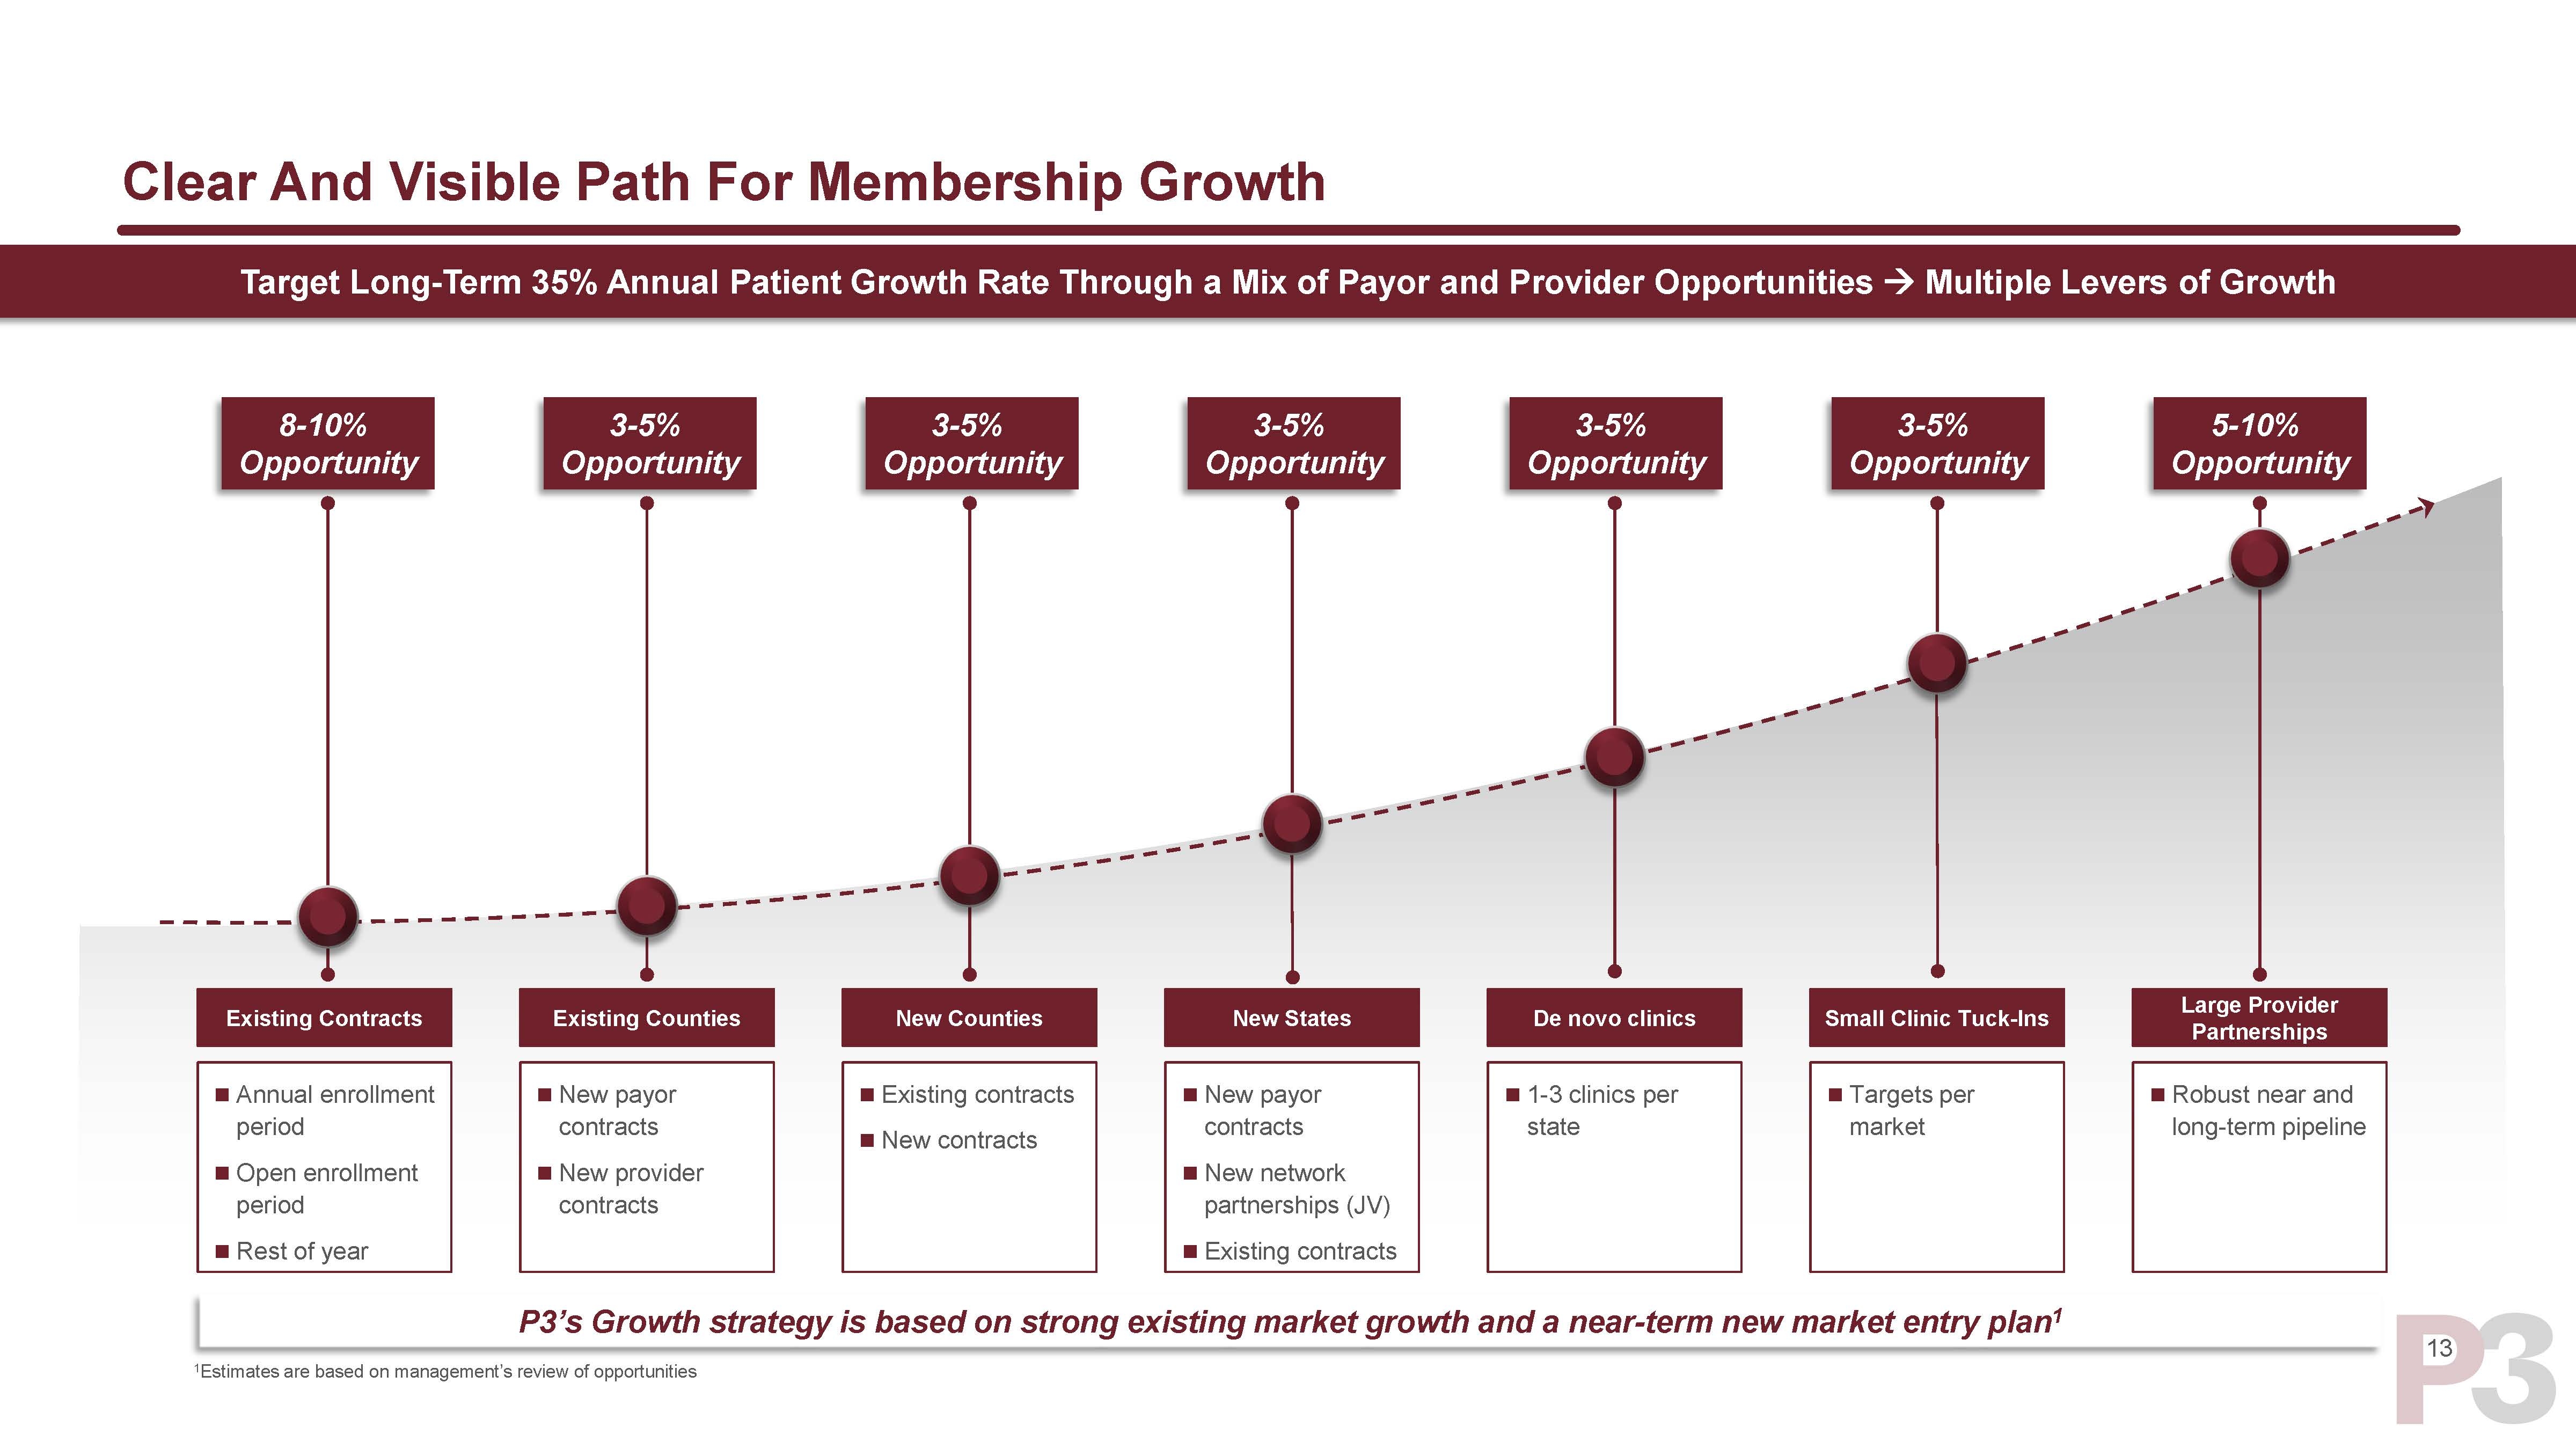
| 13 Clear And Visible Path For Membership Growth Target Long-Term 35% Annual Patient Growth Rate Through a Mix of Payor and Provider Opportunities Multiple Levers of Growth P3’s Growth strategy is based on strong existing market growth and a near-term new market entry plan1 Existing Contracts Annual enrollment period Open enrollment period Rest of year Existing Counties New payor contracts New provider contracts New Counties Existing contracts New contracts New States New payor contracts New network partnerships (JV) Existing contracts De novo clinics 1-3 clinics per state Small Clinic Tuck-Ins Targets per market Large Provider Partnerships Robust near and long-term pipeline 8-10% Opportunity 3-5% Opportunity 3-5% Opportunity 3-5% Opportunity 3-5% Opportunity 3-5% Opportunity 5-10% Opportunity 1Estimates are based on management’s review of opportunities |
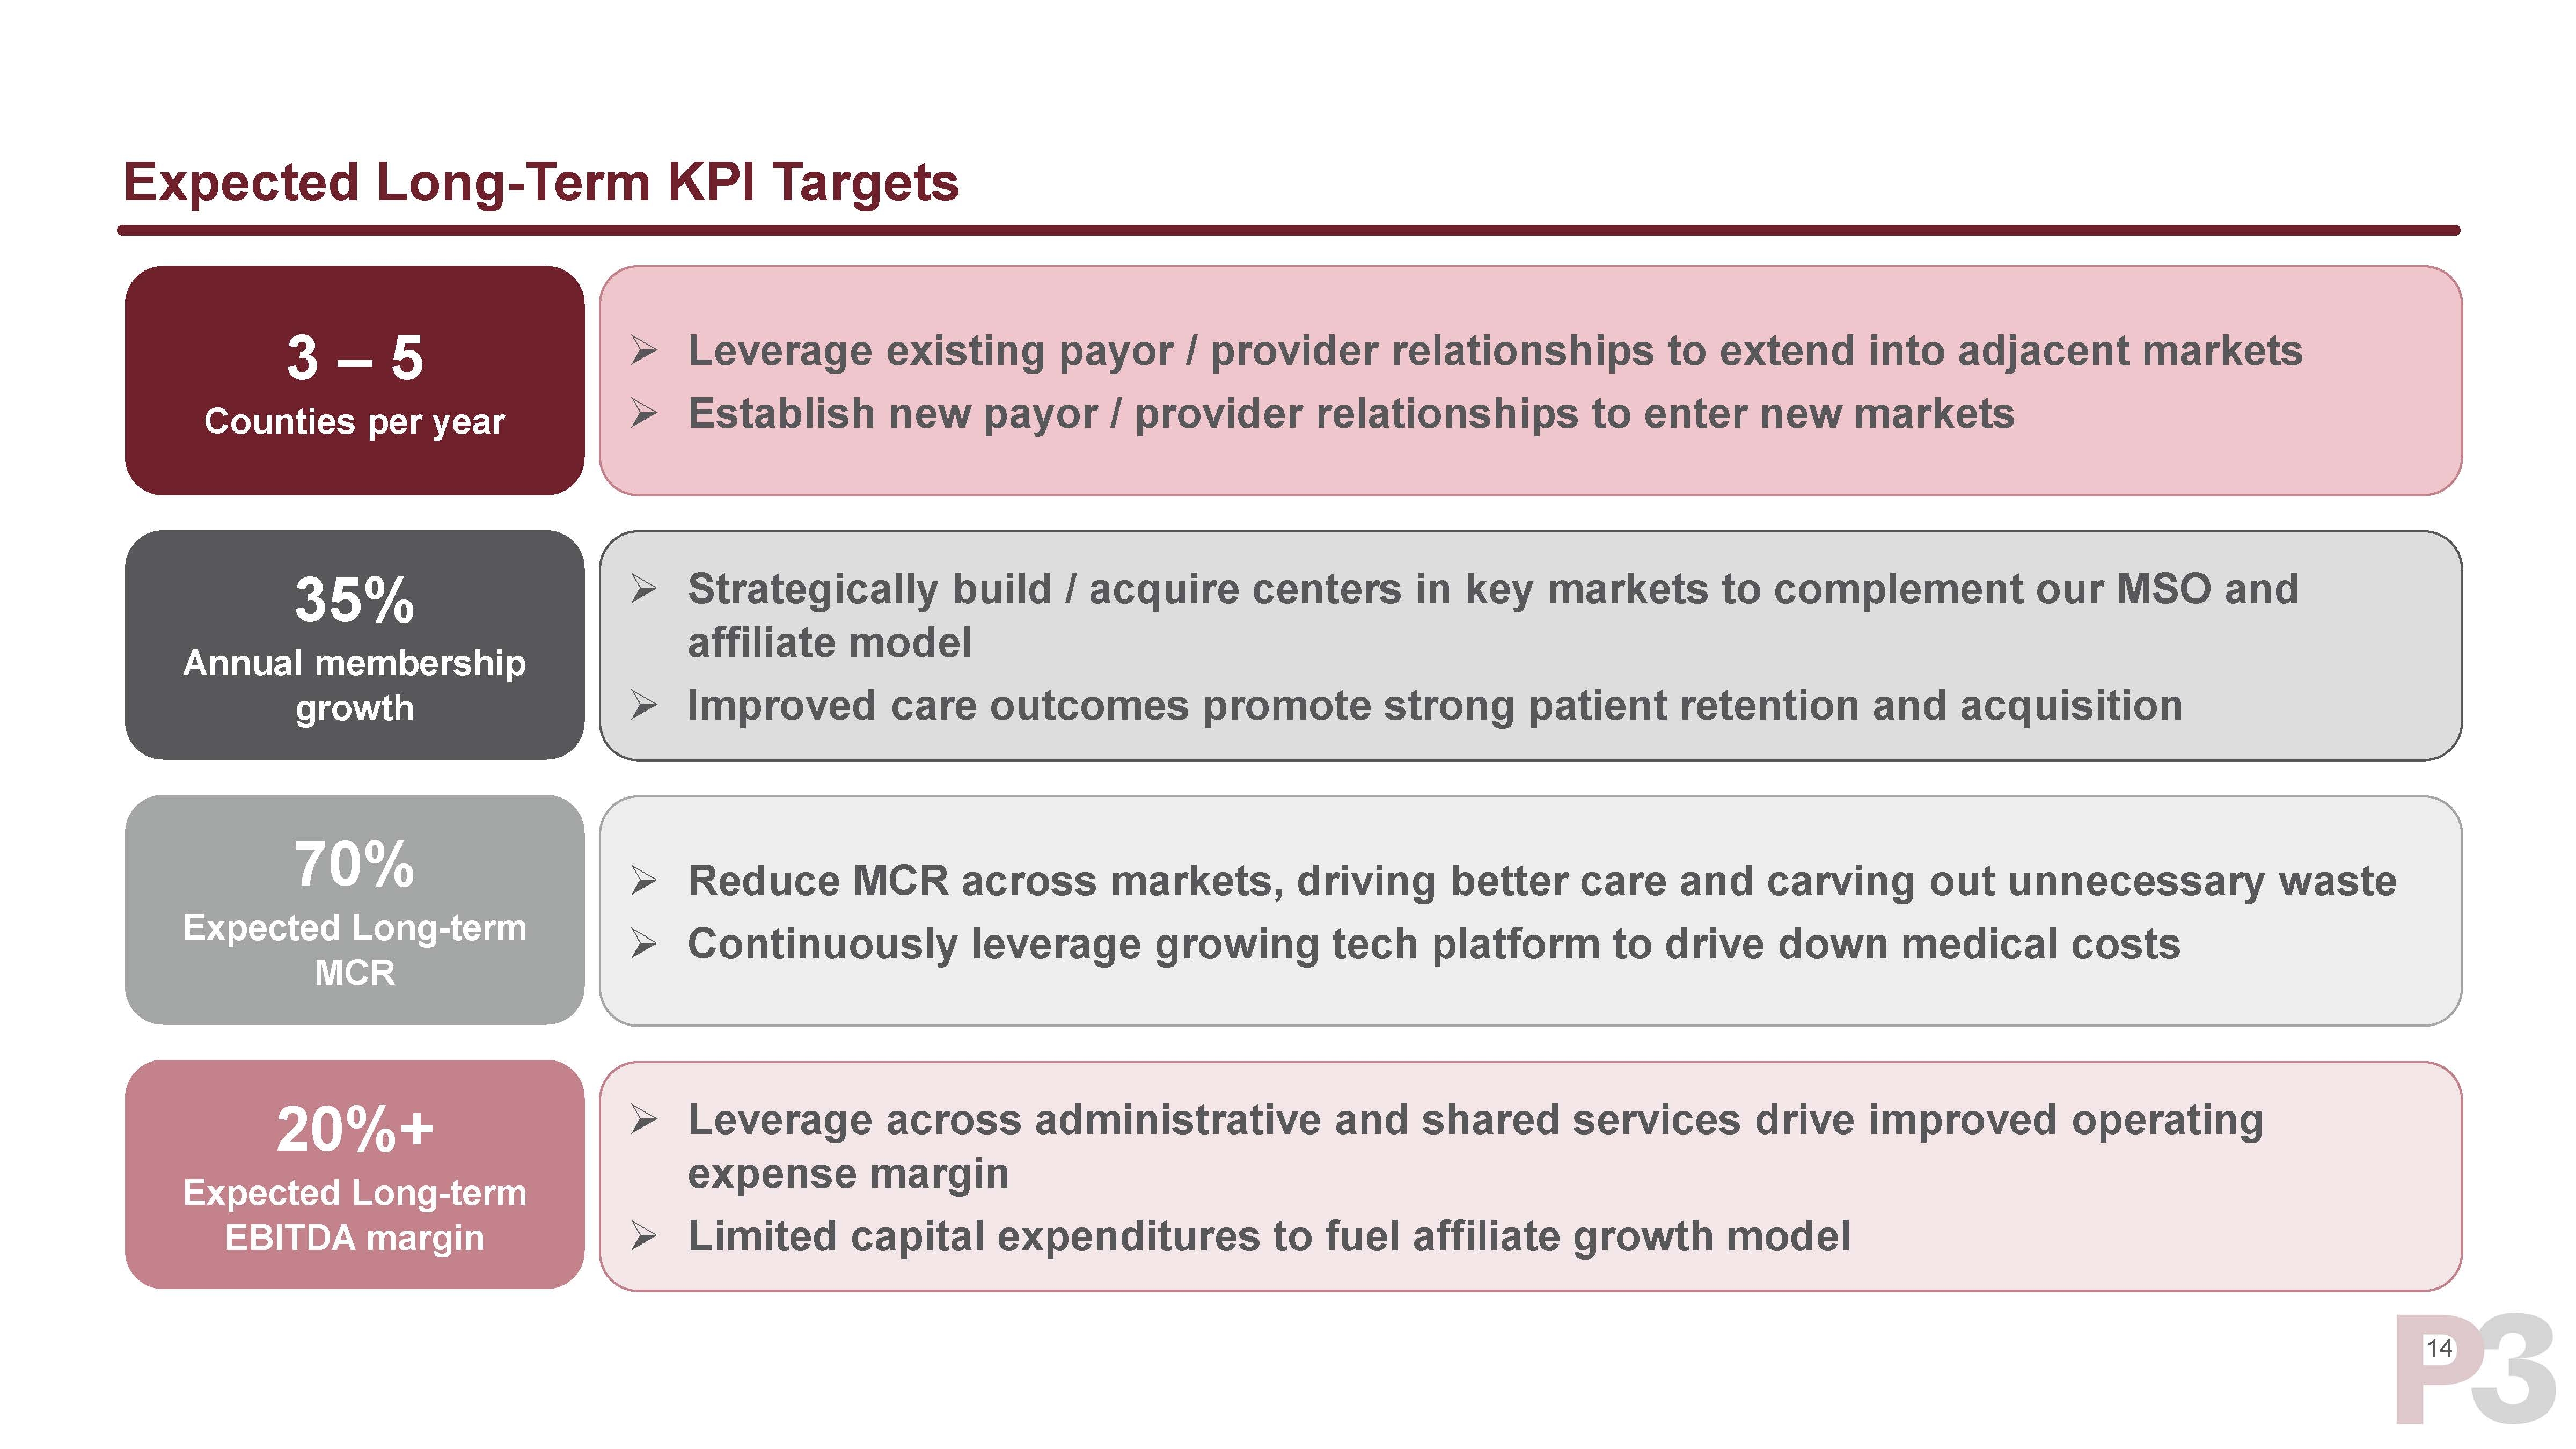
| 14 Expected Long-Term KPI Targets 3 – 5 Counties per year 35% Annual membership growth 20%+ Expected Long-term EBITDA margin Leverage existing payor / provider relationships to extend into adjacent markets Establish new payor / provider relationships to enter new markets Strategically build / acquire centers in key markets to complement our MSO and affiliate model Improved care outcomes promote strong patient retention and acquisition Leverage across administrative and shared services drive improved operating expense margin Limited capital expenditures to fuel affiliate growth model 70% Expected Long-term MCR Reduce MCR across markets, driving better care and carving out unnecessary waste Continuously leverage growing tech platform to drive down medical costs |
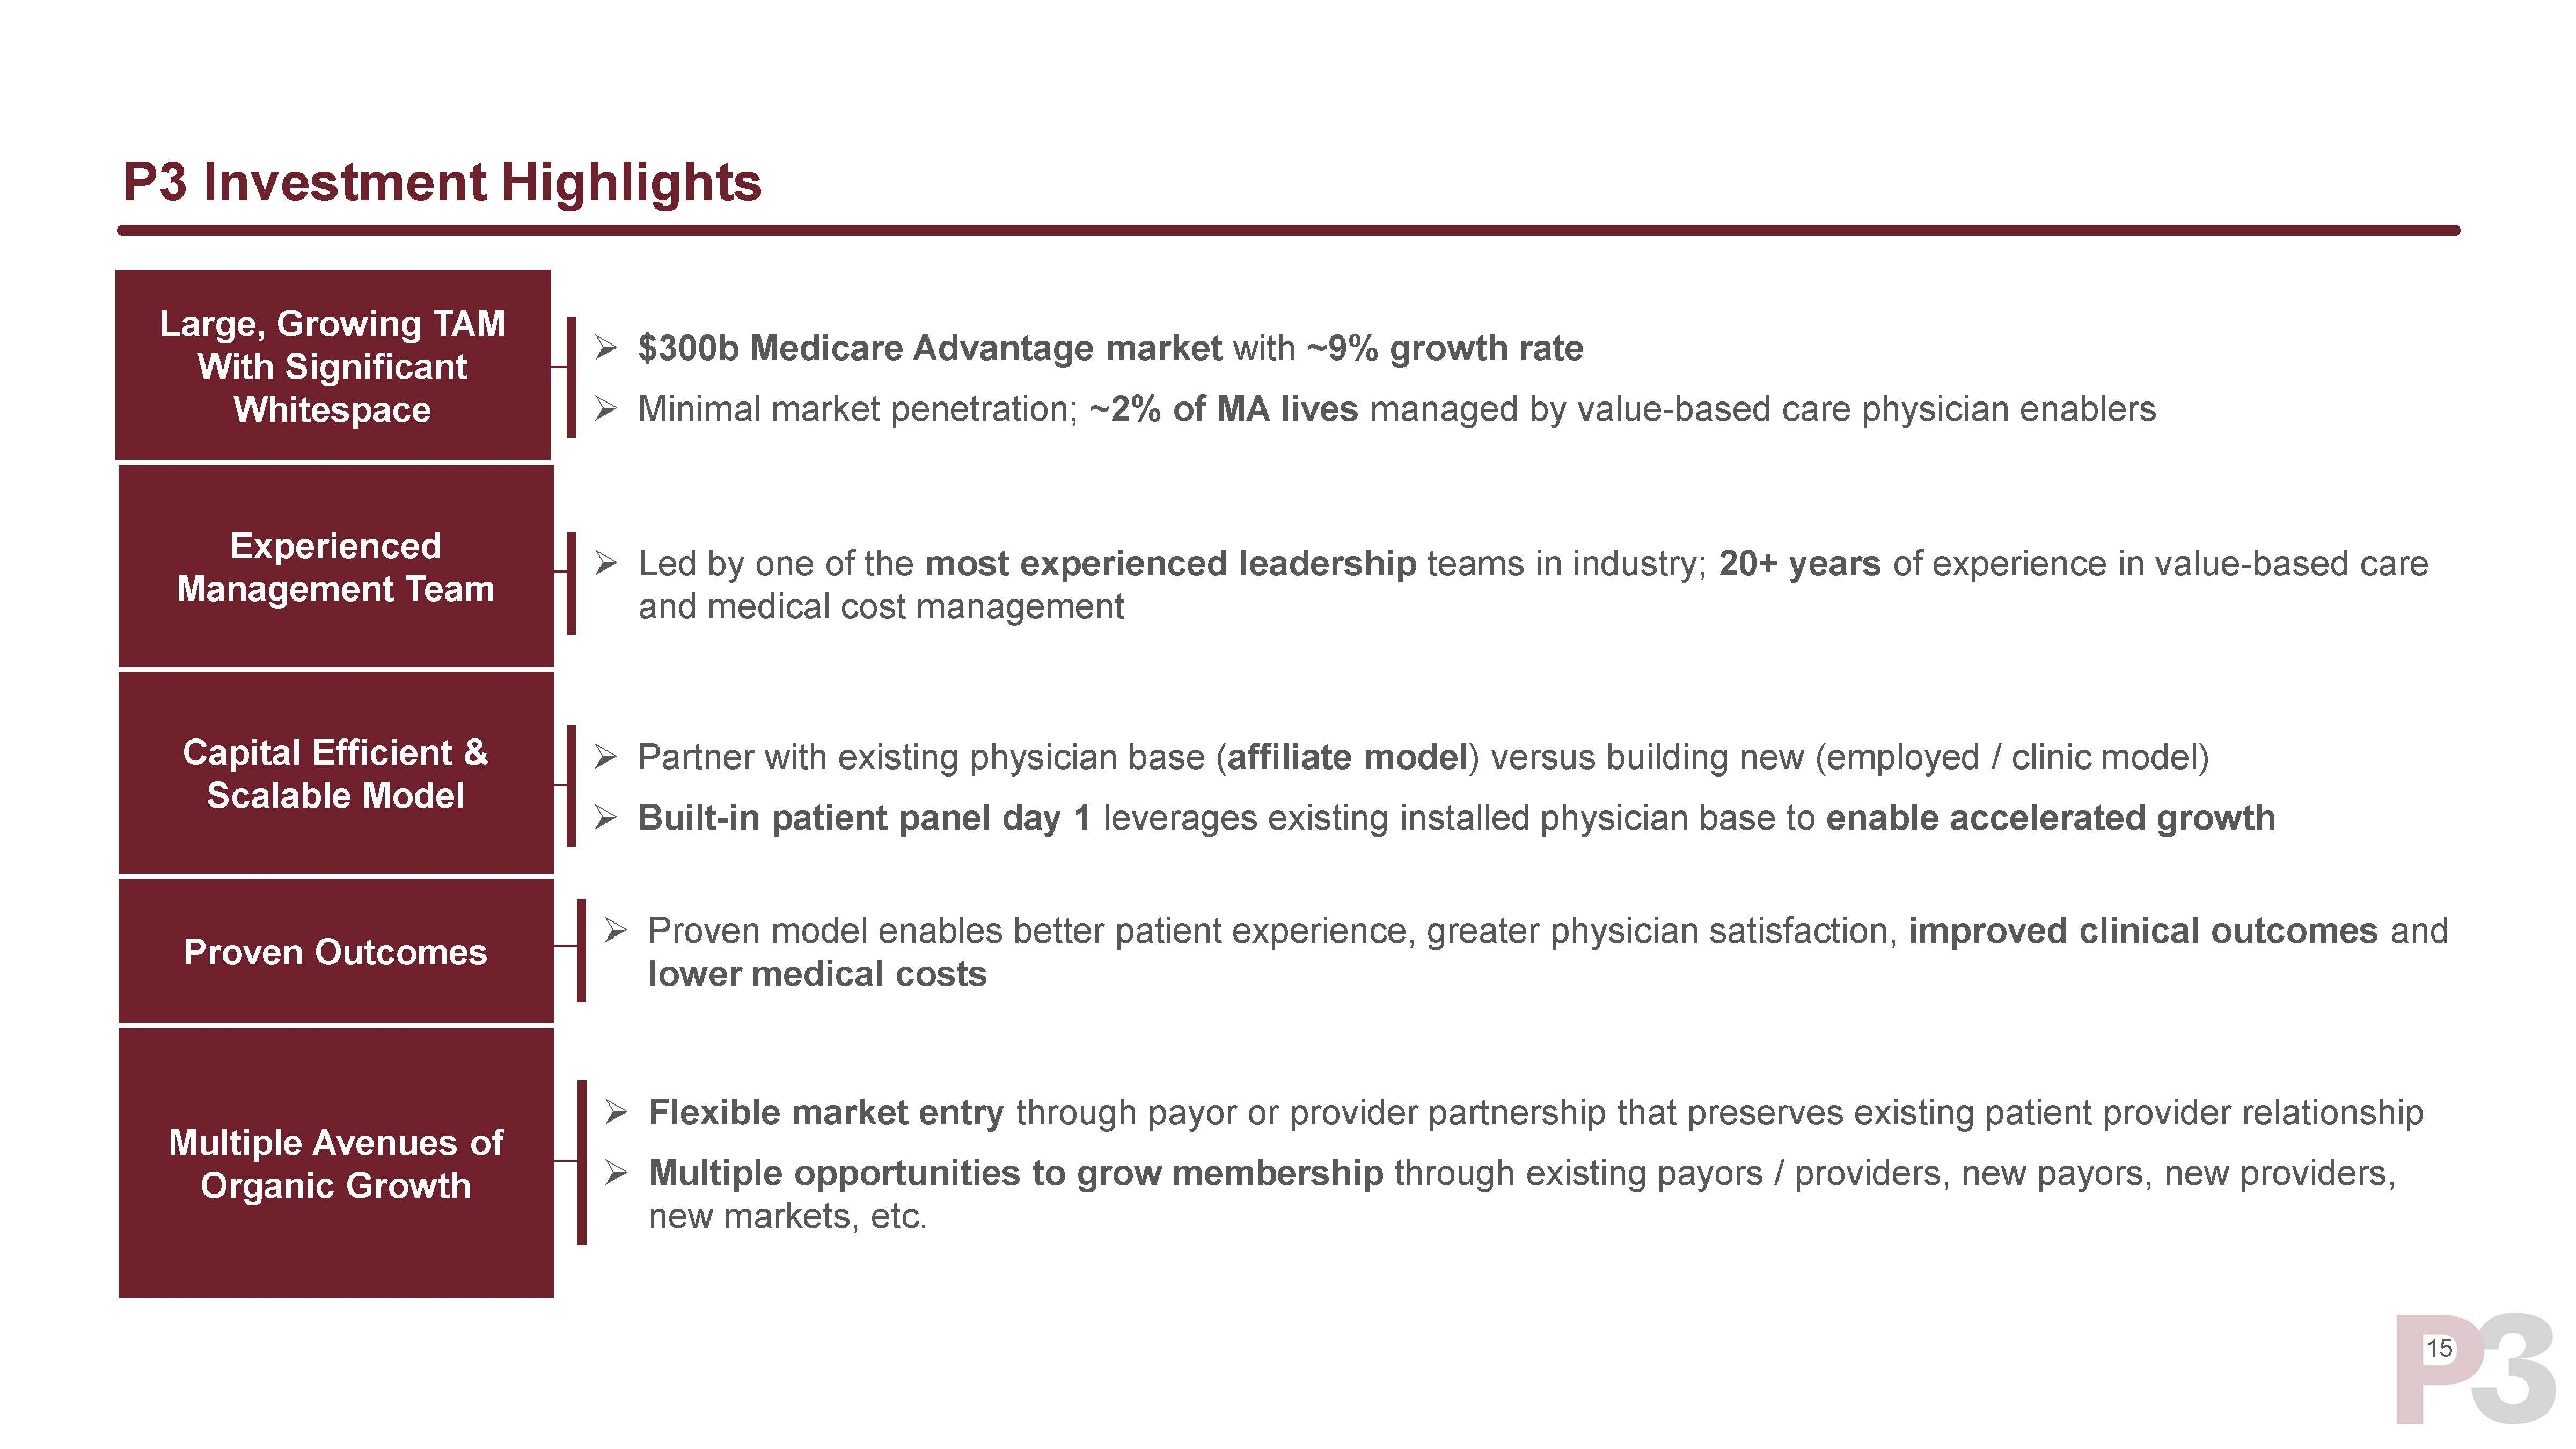
| 15 P3 Investment Highlights Experienced Management Team Led by one of the most experienced leadership teams in industry; 20+ years of experience in value-based care and medical cost management Capital Efficient & Scalable Model Partner with existing physician base (affiliate model) versus building new (employed / clinic model) Built-in patient panel day 1 leverages existing installed physician base to enable accelerated growth Proven Outcomes Proven model enables better patient experience, greater physician satisfaction, improved clinical outcomes and lower medical costs Multiple Avenues of Organic Growth Flexible market entry through payor or provider partnership that preserves existing patient provider relationship Multiple opportunities to grow membership through existing payors / providers, new payors, new providers, new markets, etc. Large, Growing TAM With Significant Whitespace $300b Medicare Advantage market with ~9% growth rate Minimal market penetration; ~2% of MA lives managed by value-based care physician enablers |
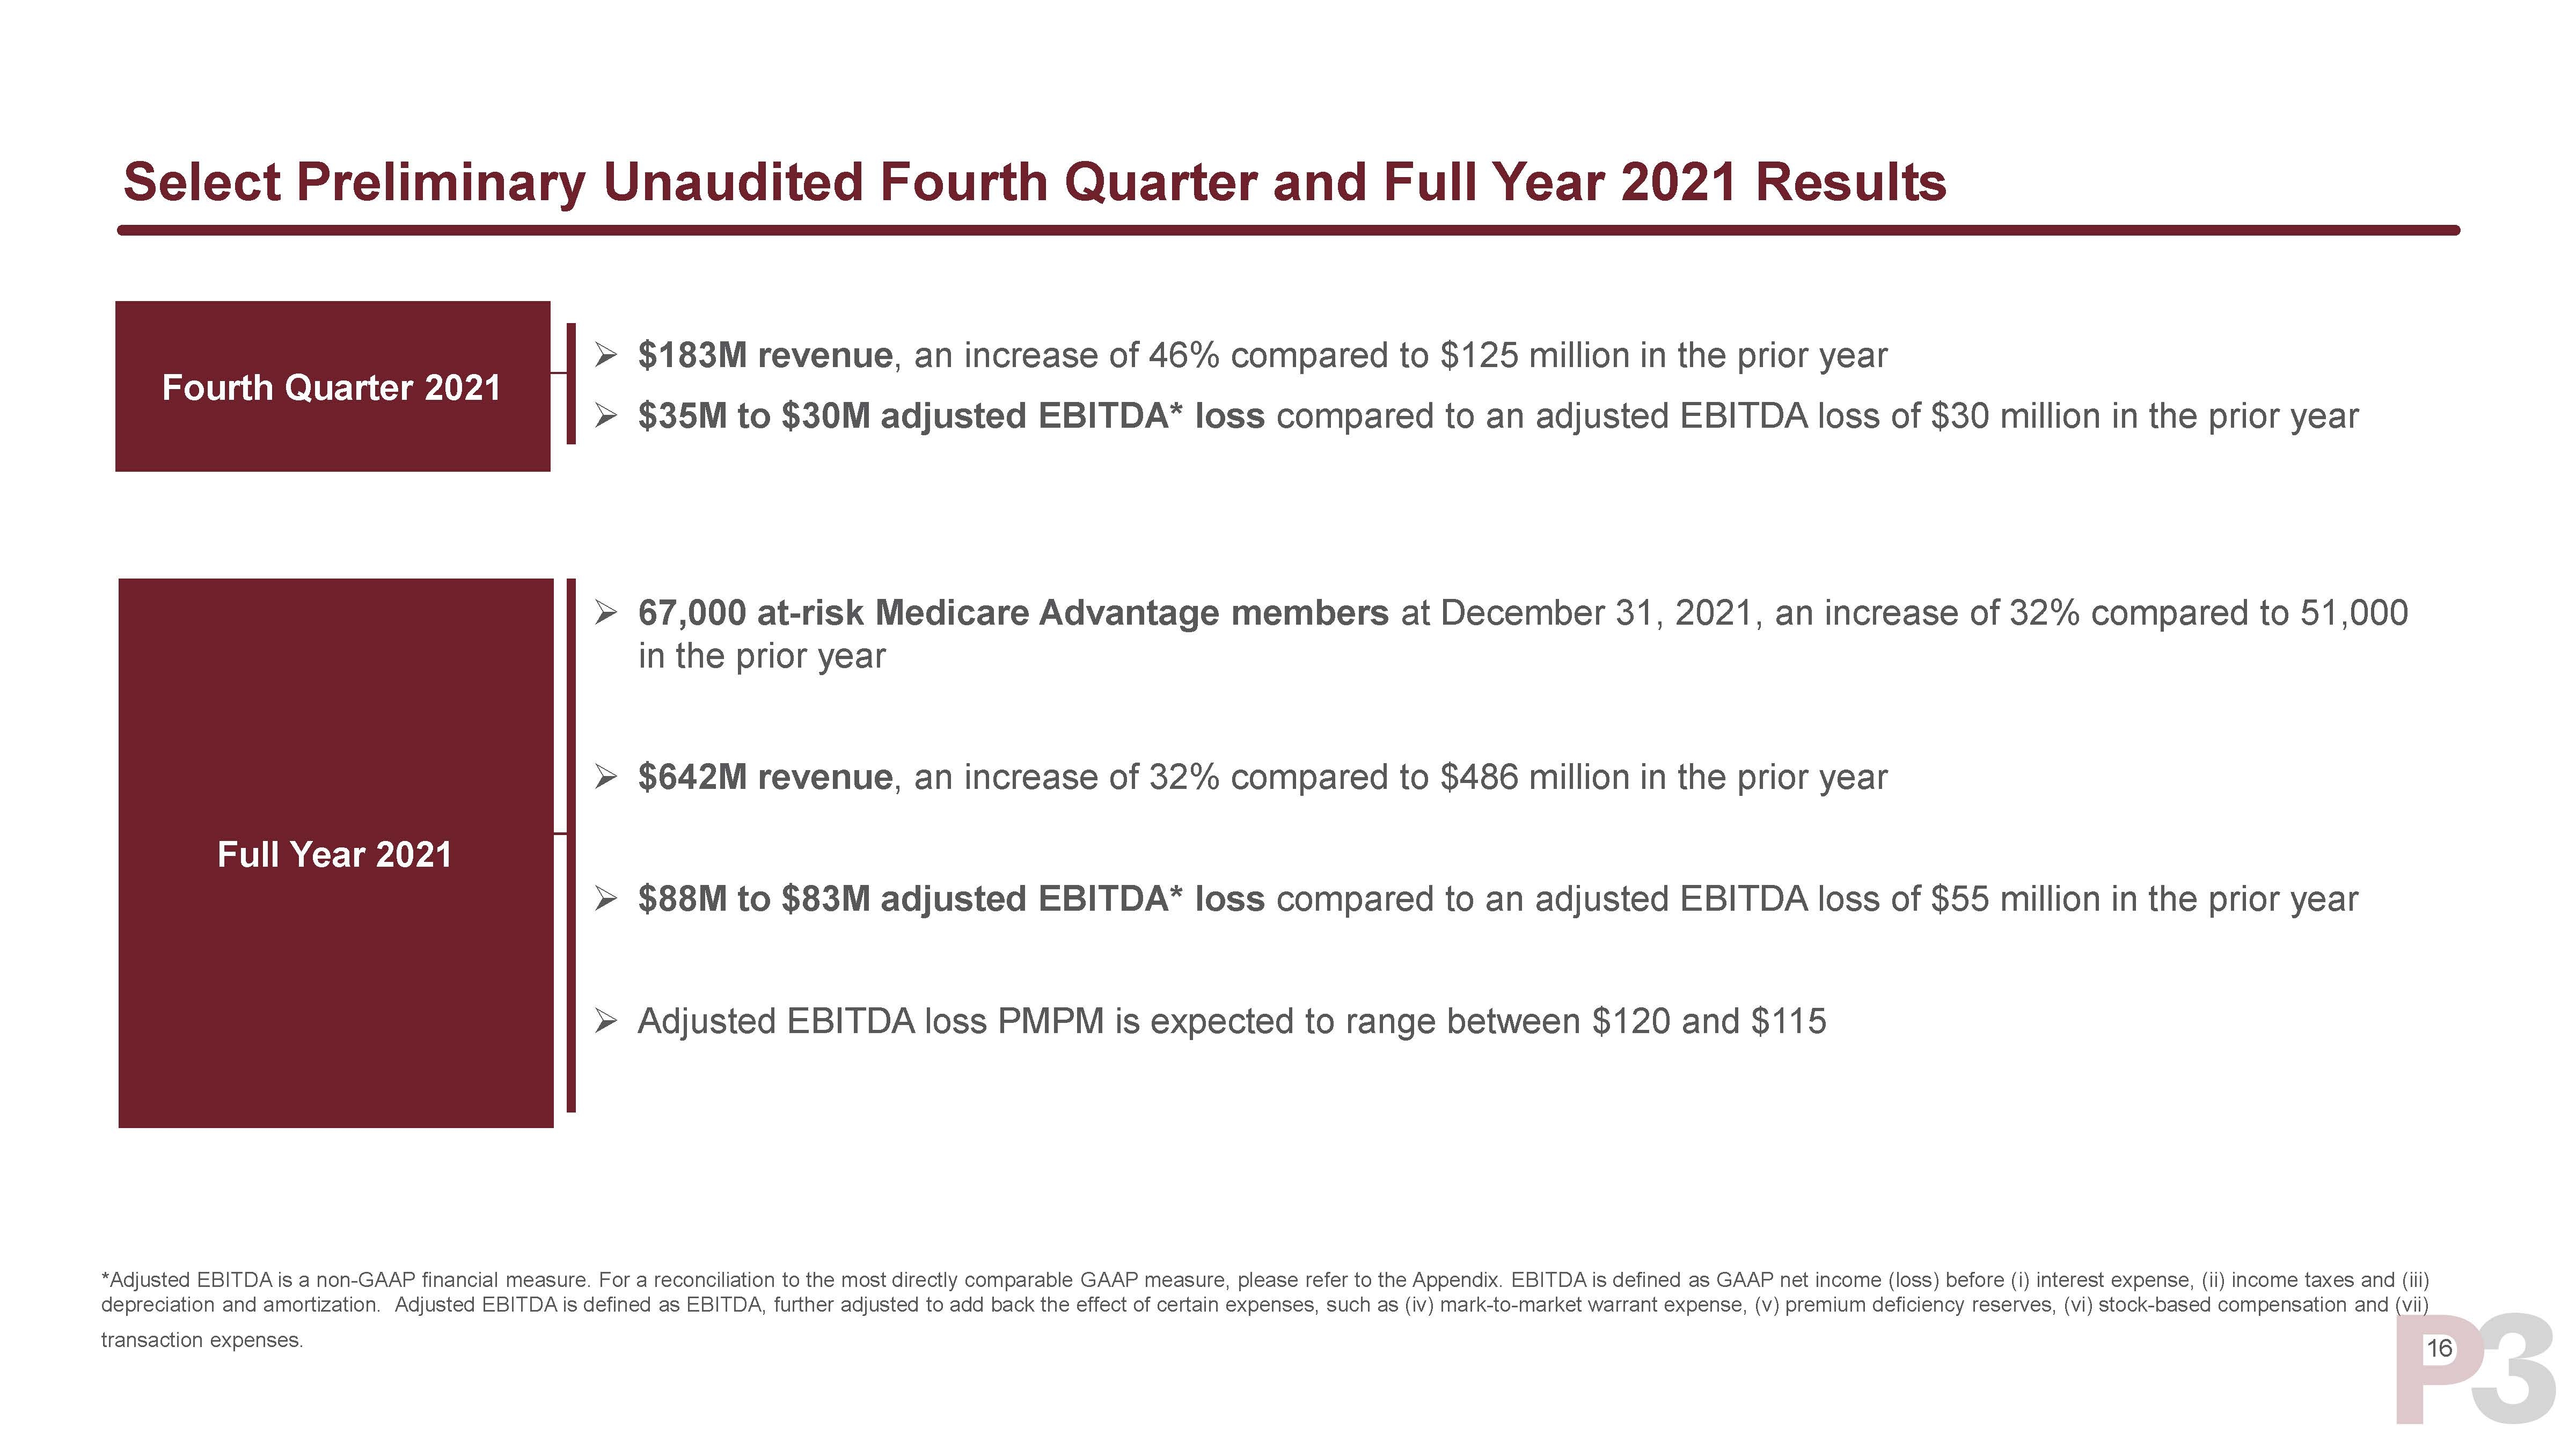
| 16 Select Preliminary Unaudited Fourth Quarter and Full Year 2021 Results Full Year 2021 67,000 at-risk Medicare Advantage members at December 31, 2021, an increase of 32% compared to 51,000 in the prior year $642M revenue, an increase of 32% compared to $486 million in the prior year $88M to $83M adjusted EBITDA* loss compared to an adjusted EBITDA loss of $55 million in the prior year Adjusted EBITDA loss PMPM is expected to range between $120 and $115 Fourth Quarter 2021 $183M revenue, an increase of 46% compared to $125 million in the prior year $35M to $30M adjusted EBITDA* loss compared to an adjusted EBITDA loss of $30 million in the prior year *Adjusted EBITDA is a non-GAAP financial measure. For a reconciliation to the most directly comparable GAAP measure, please refer to the Appendix. EBITDA is defined as GAAP net income (loss) before (i) interest expense, (ii) income taxes and (iii) depreciation and amortization. Adjusted EBITDA is defined as EBITDA, further adjusted to add back the effect of certain expenses, such as (iv) mark-to-market warrant expense, (v) premium deficiency reserves, (vi) stock-based compensation and (vii) transaction expenses. |
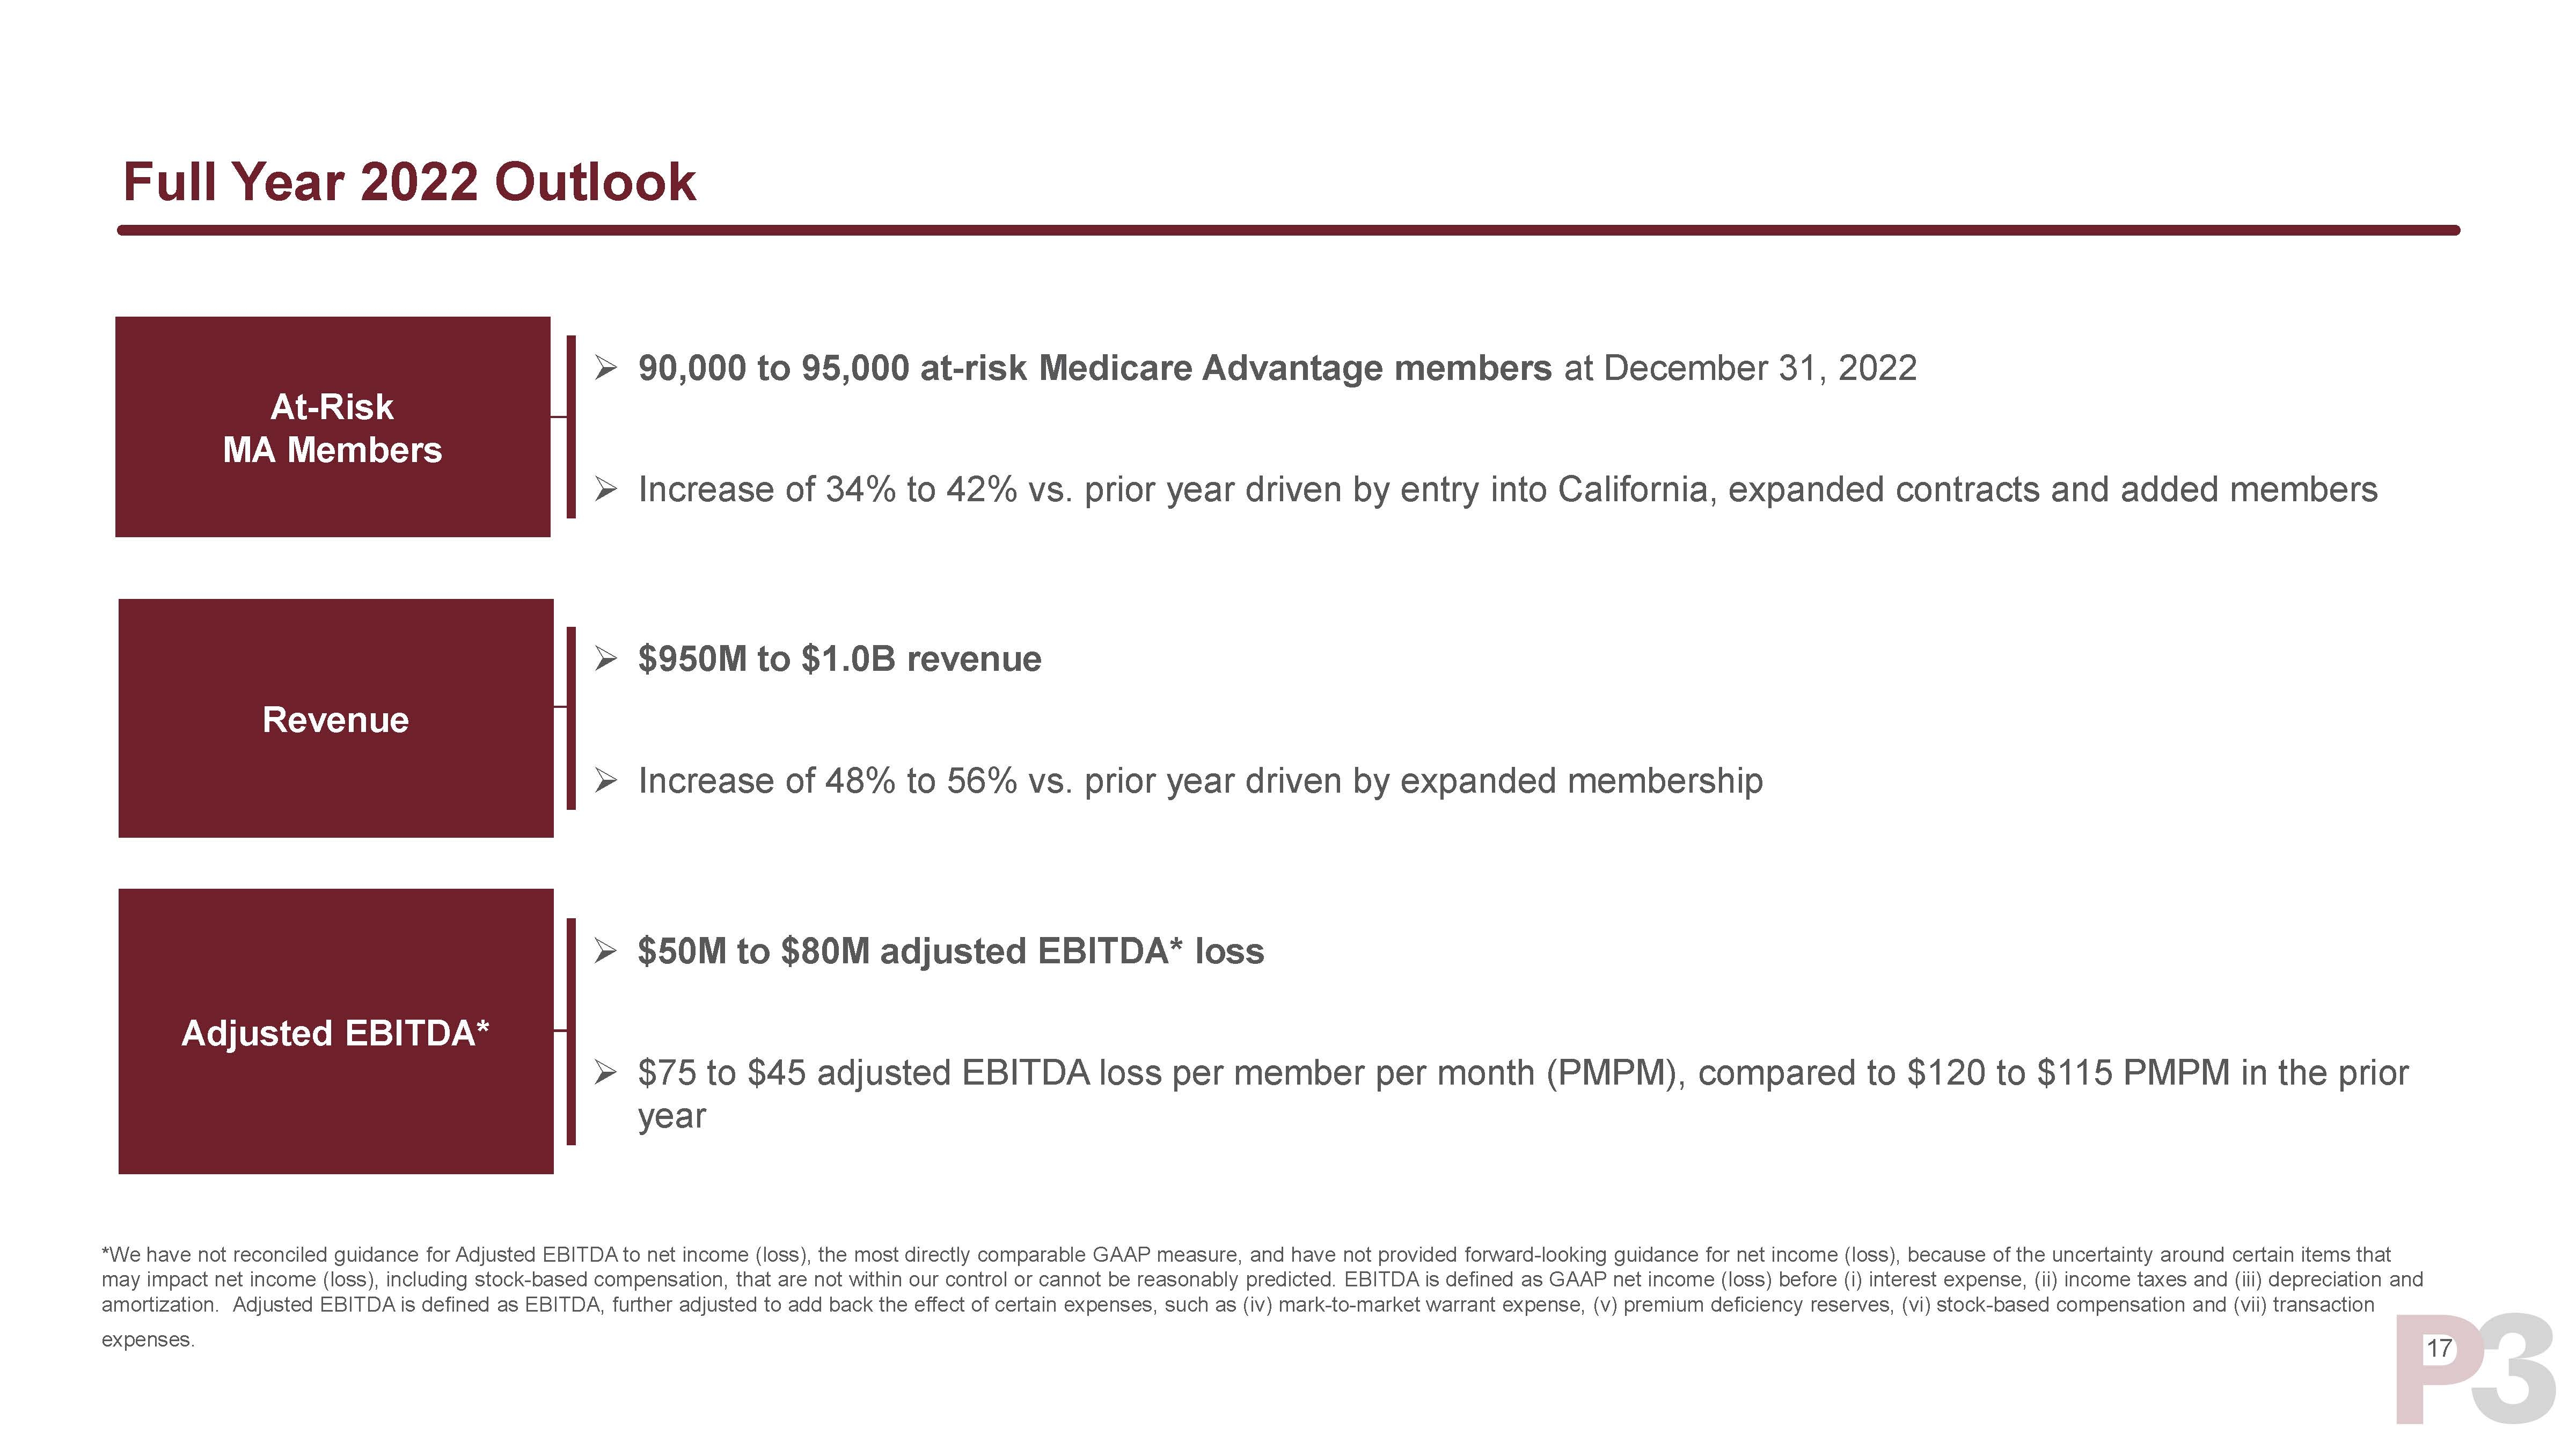
| 17 Full Year 2022 Outlook Revenue $950M to $1.0B revenue Increase of 48% to 56% vs. prior year driven by expanded membership Adjusted EBITDA* $50M to $80M adjusted EBITDA* loss $75 to $45 adjusted EBITDA loss per member per month (PMPM), compared to $120 to $115 PMPM in the prior year At-Risk MA Members 90,000 to 95,000 at-risk Medicare Advantage members at December 31, 2022 Increase of 34% to 42% vs. prior year driven by entry into California, expanded contracts and added members *We have not reconciled guidance for Adjusted EBITDA to net income (loss), the most directly comparable GAAP measure, and have not provided forward-looking guidance for net income (loss), because of the uncertainty around certain items that may impact net income (loss), including stock-based compensation, that are not within our control or cannot be reasonably predicted. EBITDA is defined as GAAP net income (loss) before (i) interest expense, (ii) income taxes and (iii) depreciation and amortization. Adjusted EBITDA is defined as EBITDA, further adjusted to add back the effect of certain expenses, such as (iv) mark-to-market warrant expense, (v) premium deficiency reserves, (vi) stock-based compensation and (vii) transaction expenses. |
| P3 Health Partners – Thank You |

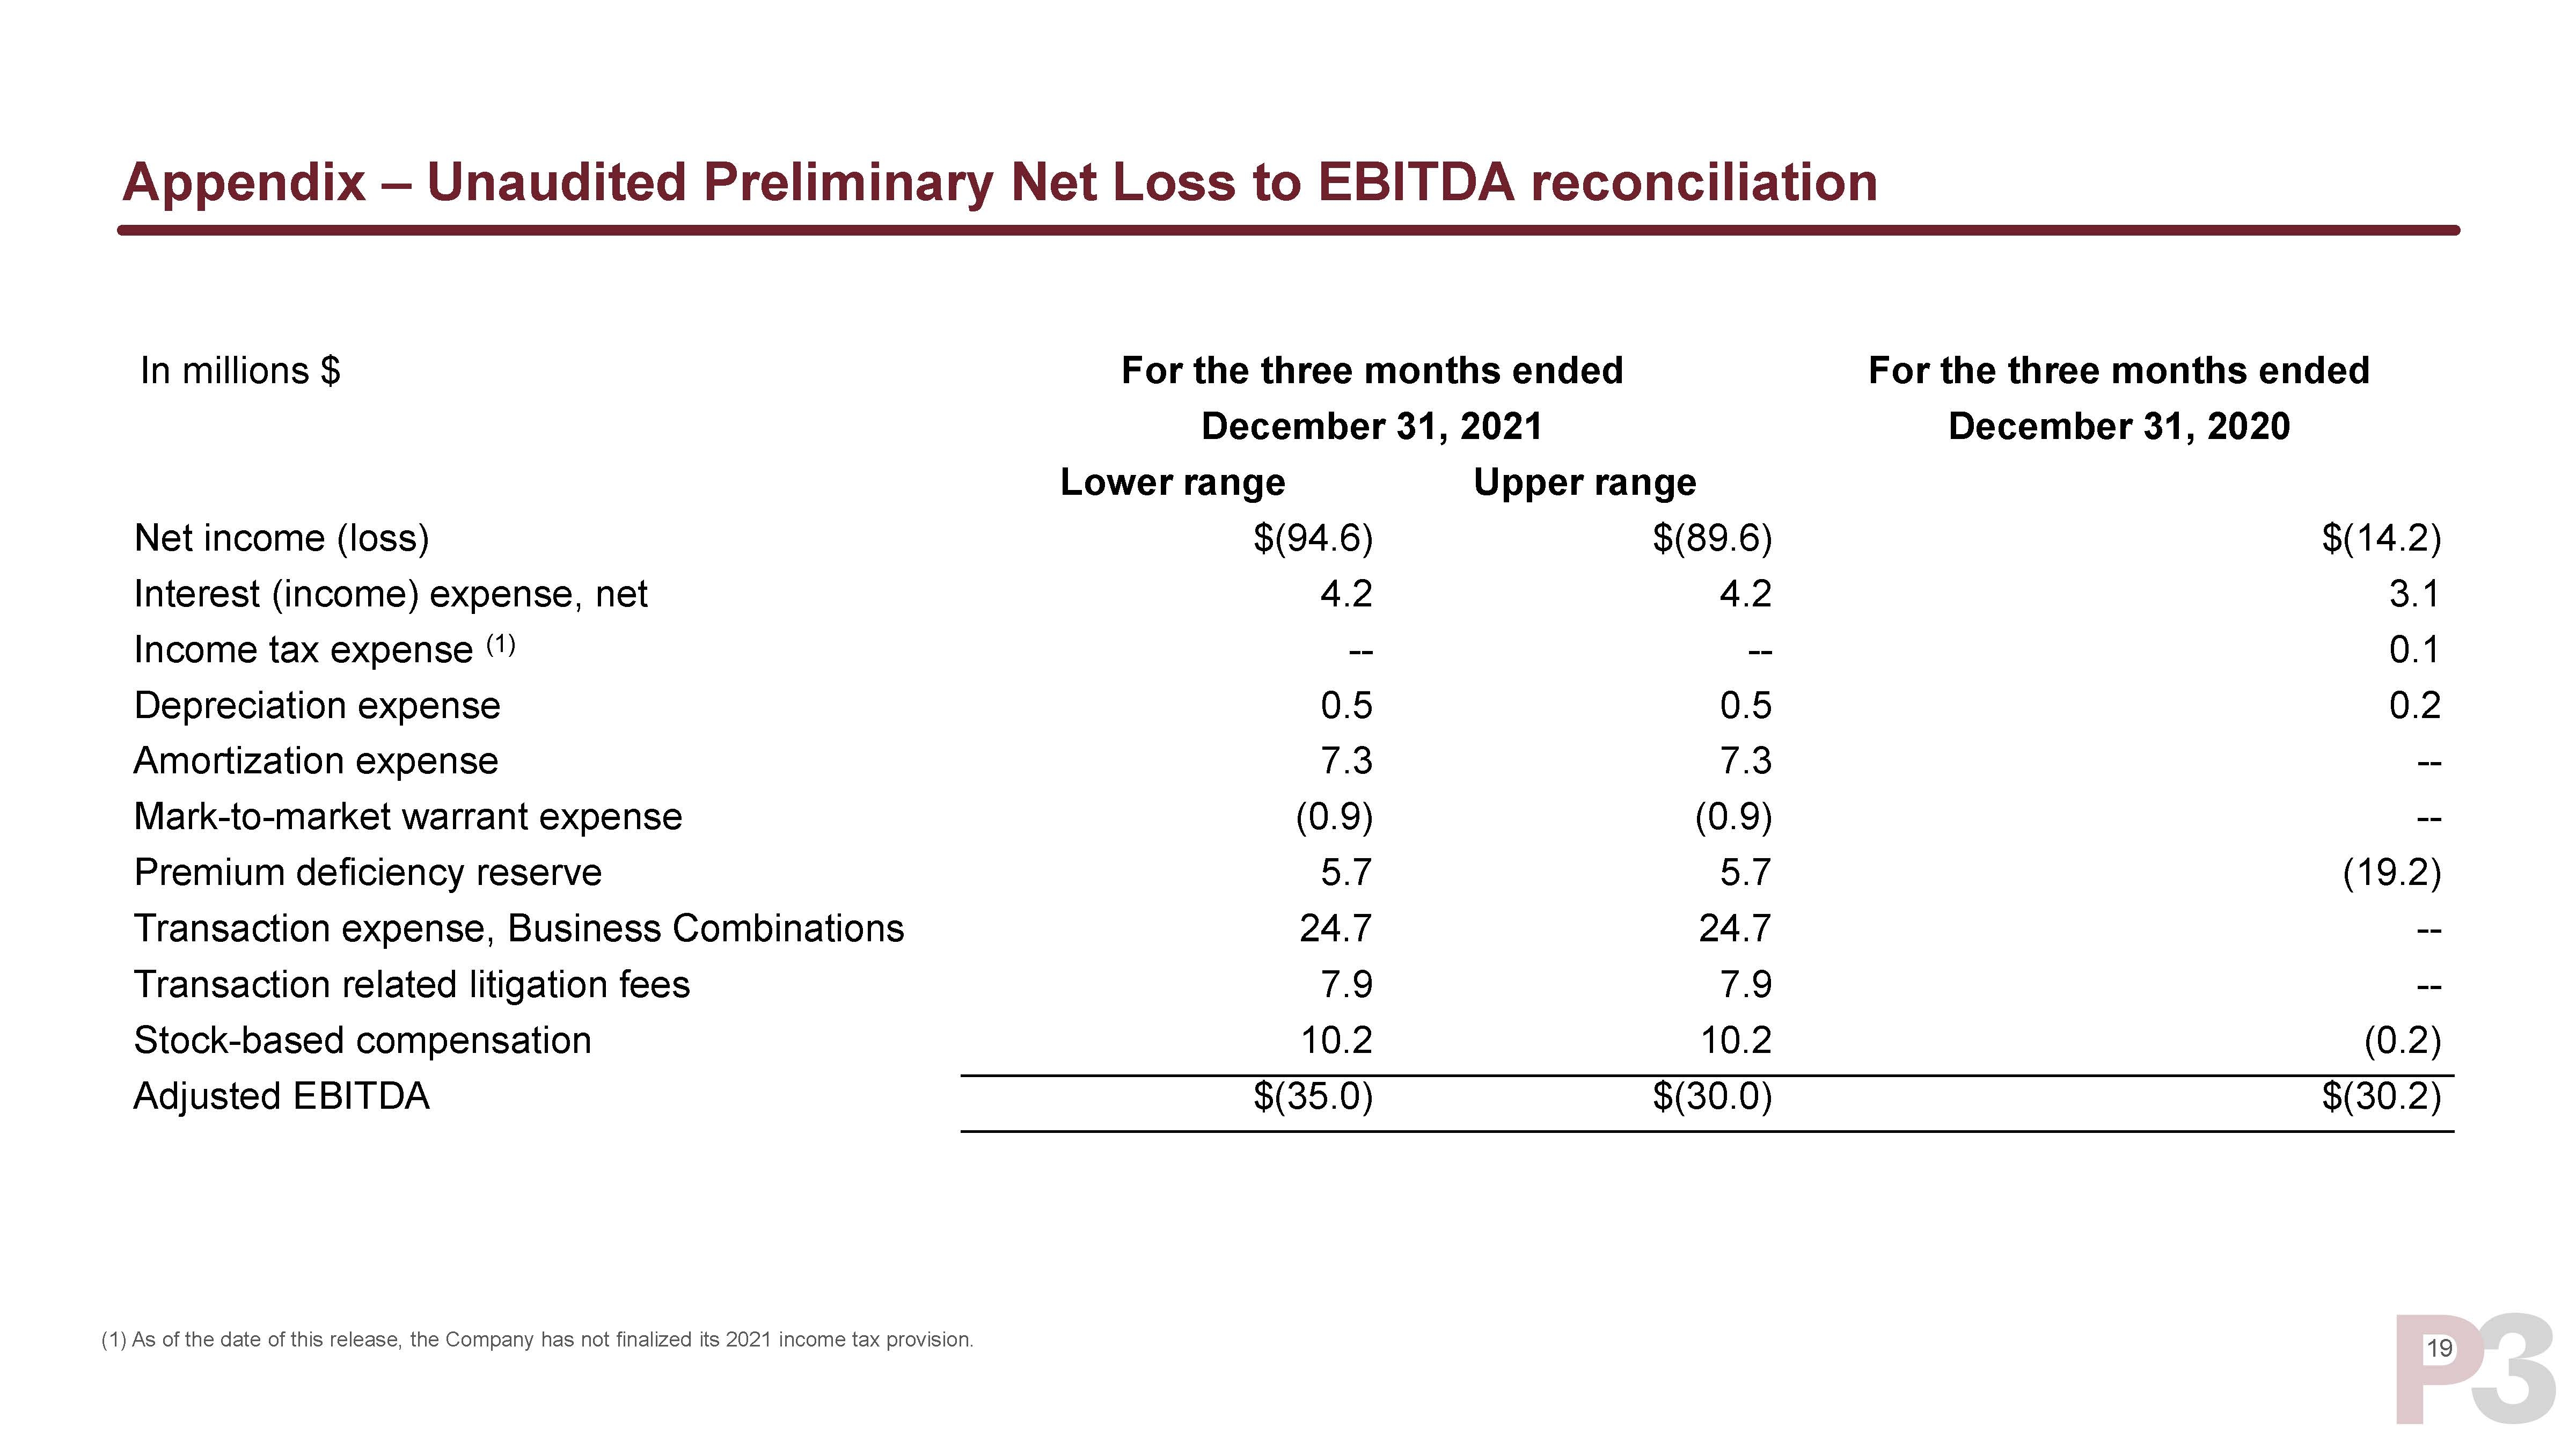
| 19 Appendix – Unaudited Preliminary Net Loss to EBITDA reconciliation In millions $ For the three months ended For the three months ended December 31, 2021 December 31, 2020 Lower range Upper range Net income (loss) $(94.6) $(89.6) $(14.2) Interest (income) expense, net 4.2 4.2 3.1 Income tax expense (1) -- -- 0.1 Depreciation expense 0.5 0.5 0.2 Amortization expense 7.3 7.3 -- Mark-to-market warrant expense (0.9) (0.9) -- Premium deficiency reserve 5.7 5.7 (19.2) Transaction expense, Business Combinations 24.7 24.7 -- Transaction related litigation fees 7.9 7.9 -- Stock-based compensation 10.2 10.2 (0.2) Adjusted EBITDA $(35.0) $(30.0) $(30.2) (1) As of the date of this release, the Company has not finalized its 2021 income tax provision. |
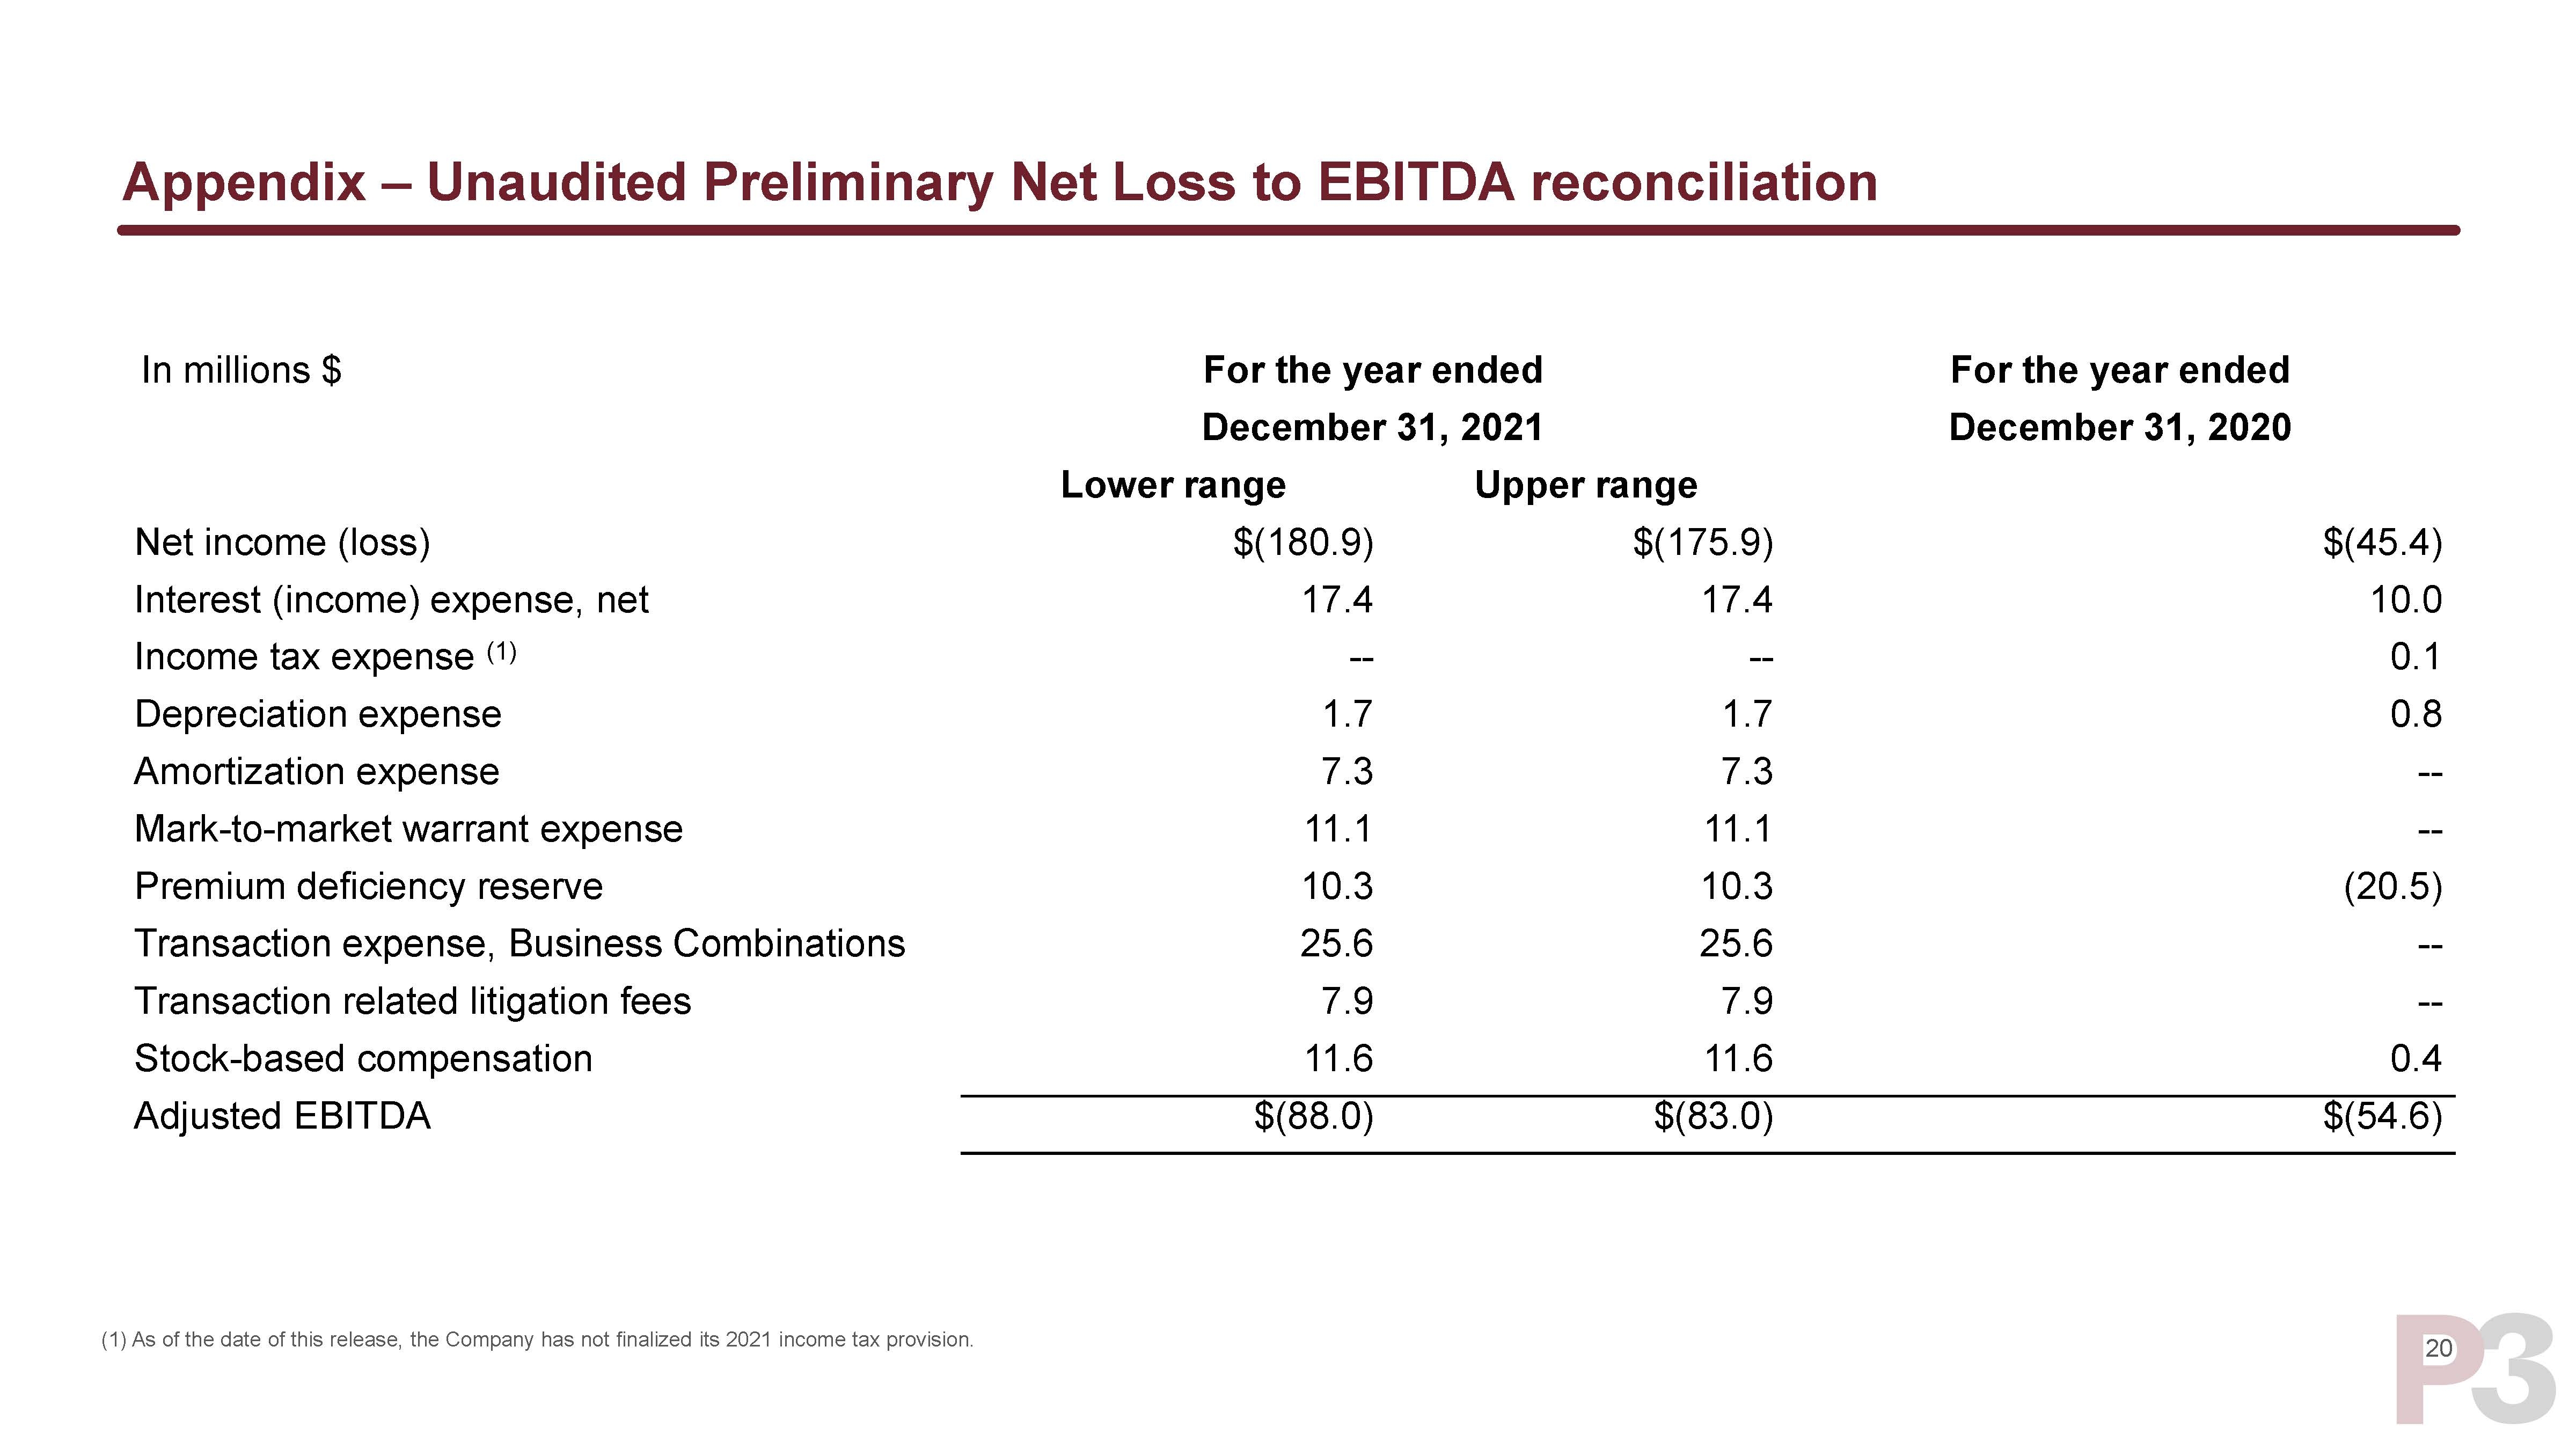
| 20 Appendix – Unaudited Preliminary Net Loss to EBITDA reconciliation In millions $ For the year ended For the year ended December 31, 2021 December 31, 2020 Lower range Upper range Net income (loss) $(180.9) $(175.9) $(45.4) Interest (income) expense, net 17.4 17.4 10.0 Income tax expense (1) -- -- 0.1 Depreciation expense 1.7 1.7 0.8 Amortization expense 7.3 7.3 -- Mark-to-market warrant expense 11.1 11.1 -- Premium deficiency reserve 10.3 10.3 (20.5) Transaction expense, Business Combinations 25.6 25.6 -- Transaction related litigation fees 7.9 7.9 -- Stock-based compensation 11.6 11.6 0.4 Adjusted EBITDA $(88.0) $(83.0) $(54.6) (1) As of the date of this release, the Company has not finalized its 2021 income tax provision. |
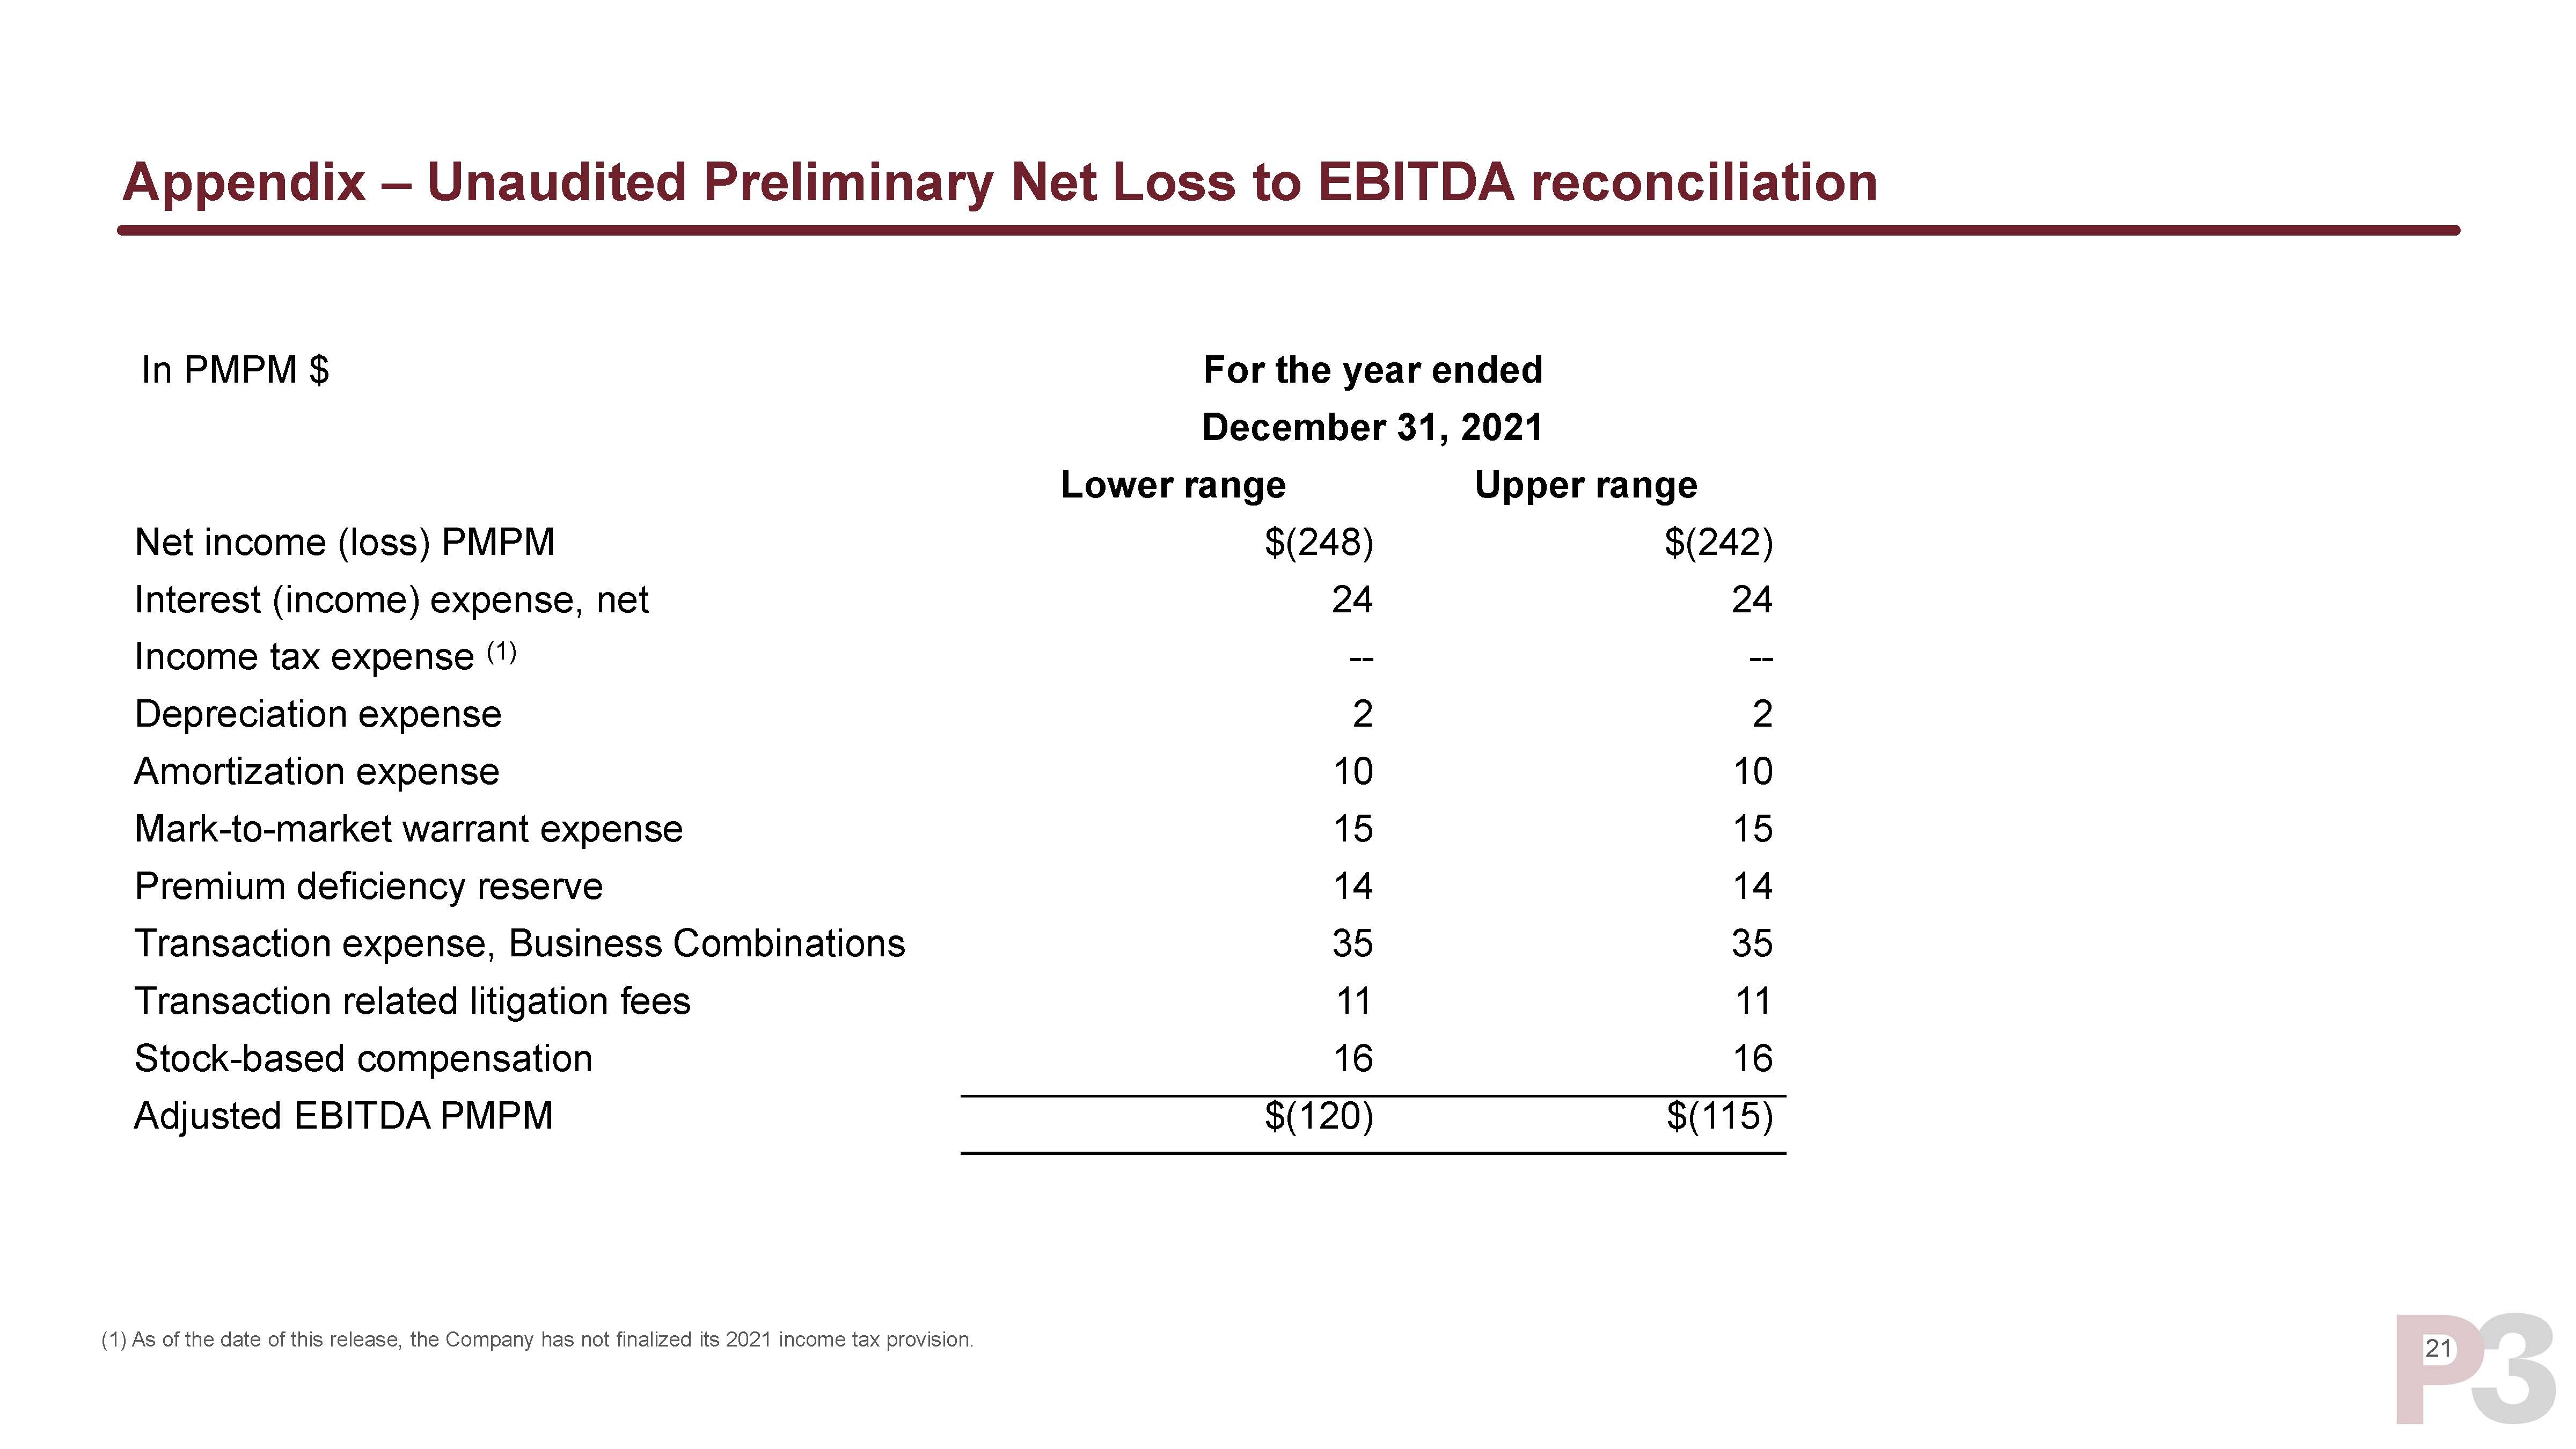
| 21 Appendix – Unaudited Preliminary Net Loss to EBITDA reconciliation In PMPM $ For the year ended December 31, 2021 Lower range Upper range Net income (loss) PMPM $(248) $(242) Interest (income) expense, net 24 24 Income tax expense (1) -- -- Depreciation expense 2 2 Amortization expense 10 10 Mark-to-market warrant expense 15 15 Premium deficiency reserve 14 14 Transaction expense, Business Combinations 35 35 Transaction related litigation fees 11 11 Stock-based compensation 16 16 Adjusted EBITDA PMPM $(120) $(115) (1) As of the date of this release, the Company has not finalized its 2021 income tax provision. |