Exhibit 99.1
P3 HEALTH GROUP HOLDINGS, LLC and SUBSIDIARIES
CONDENSED CONSOLIDATED FINANCIAL STATEMENTS (UNAUDITED)
FOR THE THREE AND NINE MONTHS ENDED SEPTEMBER 30, 2021 and 2020
1
P3 HEALTH GROUP HOLDINGS, LLC and SUBSIDIARIES
CONDENSED CONSOLIDATED BALANCE SHEETS
| ASSETS | ||||||||
| Unaudited | ||||||||
| September 30, 2021 | December 31, 2020 | |||||||
| CURRENT ASSETS: | ||||||||
| Cash | $ | 4,336,565 | $ | 36,261,104 | ||||
| Restricted Cash | 346,299 | 3,641,843 | ||||||
| Health Plan Settlement Receivables | 45,847,310 | 38,429,833 | ||||||
| Clinic Fees and Insurance Receivables, Net | 423,885 | 675,954 | ||||||
| Other Receivables | 343,583 | 146,117 | ||||||
| Prepaid Expenses and Other Current Assets | 2,525,356 | 5,192,783 | ||||||
| TOTAL CURRENT ASSETS | 53,822,998 | 84,347,634 | ||||||
| LONG-TERM ASSETS: | ||||||||
| Property, Plant and Equipment, Net | 7,921,914 | 6,150,586 | ||||||
| Goodwill and Other Intangibles | 5,885,628 | 871,128 | ||||||
| Notes Receivable, Net | 3,684,199 | 3,804,662 | ||||||
| Right of Use Asset | 7,190,501 | 4,728,242 | ||||||
| TOTAL LONG-TERM ASSETS | 24,682,242 | 15,554,618 | ||||||
| TOTAL ASSETS | $ | 78,505,240 | $ | 99,902,252 | ||||
| LIABILITIES and MEMBERS' DEFICIT | ||||||||
| CURRENT LIABILITIES: | ||||||||
| Accounts Payable and Accrued Expenses | $ | 15,399,853 | $ | 11,793,125 | ||||
| Accrued Payroll | 2,160,497 | 4,003,373 | ||||||
| Health Plans Settlements Payable | 13,259,118 | 13,742,775 | ||||||
| Claims Payable | 75,108,251 | 56,934,400 | ||||||
| Premium Deficiency Reserve | 4,600,000 | - | ||||||
| Accrued Interest | 8,004,450 | 4,052,406 | ||||||
| Current Portion of Long-Term Debt | 68,873 | 89,988 | ||||||
| TOTAL CURRENT LIABILITIES | 118,601,042 | 90,616,067 | ||||||
| LONG-TERM LIABILITIES: | ||||||||
| Lease Liability | 6,475,923 | 3,634,429 | ||||||
| Liability for Class D Warrants | 18,379,870 | 6,316,605 | ||||||
| Long-Term Debt | 59,358,375 | 45,387,986 | ||||||
| TOTAL LONG-TERM LIABILITIES | 84,214,168 | 55,339,020 | ||||||
| TOTAL LIABILITIES | 202,815,210 | 145,955,087 | ||||||
| Class D Units Subject to Possible
Redemption, 16,130,034 Units at $3.10 Redemption Value, Net of Issuance Costs $2,958,446, Plus Accumulated Preferred Returns of $7,895,161 and $4,567,346 at September 30, 2021 and December 31, 2020, Respectively | 54,936,716 | 51,608,900 | ||||||
| MEMBERS' DEFICIT: | ||||||||
| Contributed Capital | 41,764,270 | 41,764,270 | ||||||
| Series A Preferred Returns | 6,594,660 | 3,815,034 | ||||||
| Accumulated Equity-Based Compensation | 2,747,960 | 1,368,567 | ||||||
| Redemption of Profits Interests | (180,000 | ) | (180,000 | ) | ||||
| Retained Loss from Controlling Interests | (203,942,517 | ) | (126,242,225 | ) | ||||
| MEMBERS' DEFICIT | (153,015,627 | ) | (79,474,354 | ) | ||||
| Retained Loss from Non-Controlling Interests | (26,231,059 | ) | (18,187,381 | ) | ||||
| TOTAL MEMBERS' DEFICIT | (179,246,686 | ) | (97,661,735 | ) | ||||
| TOTAL LIABILITIES and MEMBERS' DEFICIT | $ | 78,505,240 | $ | 99,902,252 | ||||
See Accompanying Notes to Condensed Consolidated Financial Statements
2
P3 HEALTH GROUP HOLDINGS, LLC and SUBSIDIARIES
CONDENSED CONSOLIDATED STATEMENTS OF OPERATIONS (UNAUDITED)
| Three Months Ended September 30, | Nine Months Ended September 30, | |||||||||||||||
| 2021 | 2020 | 2021 | 2020 | |||||||||||||
| OPERATING REVENUE: | ||||||||||||||||
| Capitated Revenue | $ | 152,276,992 | $ | 124,461,275 | $ | 447,137,121 | $ | 351,018,290 | ||||||||
| Other Patient Service Revenue | 4,243,263 | 4,379,716 | 12,366,111 | 9,645,990 | ||||||||||||
| TOTAL OPERATING REVENUE | 156,520,255 | 128,840,991 | 459,503,232 | 360,664,280 | ||||||||||||
| OPERATING EXPENSES (INCOME): | ||||||||||||||||
| Medical Expenses | 161,662,423 | 127,015,976 | 459,233,085 | 348,258,272 | ||||||||||||
| Premium Deficiency Reserve | 1,600,000 | 1,072,540 | 4,600,000 | (1,304,962 | ) | |||||||||||
| Corporate, General and Administrative Expenses | 20,433,538 | 13,742,904 | 53,883,267 | 36,773,545 | ||||||||||||
| Sales and Marketing Expenses | 491,418 | 278,663 | 1,118,160 | 631,073 | ||||||||||||
| Depreciation | 456,418 | 245,488 | 1,218,796 | 613,329 | ||||||||||||
| TOTAL OPERATING EXPENSES | 184,643,797 | 142,355,570 | 520,053,309 | 384,971,257 | ||||||||||||
| OPERATING LOSS | (28,123,542 | ) | (13,514,579 | ) | (60,550,077 | ) | (24,306,977 | ) | ||||||||
| OTHER INCOME (EXPENSES): | ||||||||||||||||
| Interest Expense, Net | (4,643,254 | ) | (2,316,579 | ) | (13,130,628 | ) | (6,877,619 | ) | ||||||||
| Mark-to-Market Adjustment for Class D Warrants | (1,401,686 | ) | - | (12,063,265 | ) | - | ||||||||||
| TOTAL OTHER EXPENSES | (6,044,940 | ) | (2,316,579 | ) | (25,193,893 | ) | (6,877,619 | ) | ||||||||
| NET LOSS | (34,168,482 | ) | (15,831,158 | ) | (85,743,970 | ) | (31,184,596 | ) | ||||||||
| NET LOSS ATTRIBUTABLE TO NON-CONTROLLING INTERESTS | (2,801,965 | ) | 875,560 | (8,043,678 | ) | (3,450,460 | ) | |||||||||
| NET LOSS ATTRIBUTABLE TO CONTROLLING INTERESTS | $ | (31,366,517 | ) | $ | (16,706,718 | ) | $ | (77,700,292 | ) | $ | (27,734,136 | ) | ||||
| NET LOSS PER SHARE - BASIC AND DILUTED | $ | (0.45 | ) | $ | (0.25 | ) | $ | (1.14 | ) | $ | (0.42 | ) | ||||
See Accompanying Notes to Condensed Consolidated Financial Statements
3
P3 HEALTH GROUP HOLDINGS, LLC and SUBSIDIARIES
CONDENSED CONSOLIDATED STATEMENTS OF CHANGES IN MEMBERS' DEFICIT (UNAUDITED)
| Three Months Ended | ||||||||||||||||||||||||||||||||||||||||||||
| Class A | Class B-1 | Class C | Redemption of | Controlling | Non-Controlling | Total | ||||||||||||||||||||||||||||||||||||||
| Units | Amount | Preferred Return | Units | Amount | Units | Amount | Class C Units | Interests | Interests | Members' Deficit | ||||||||||||||||||||||||||||||||||
| MEMBERS' DEFICIT, June 30, 2021 | 43,000,000 | $ | 41,764,270 | $ | 5,632,497 | 8,000,000 | $ | 1,520,000 | 1,775,833 | $ | 872,872 | $ | (180,000 | ) | $ | (172,576,000 | ) | $ | (23,429,094 | ) | $ | (146,395,455 | ) | |||||||||||||||||||||
| Class B-1 and Class C Unit Based Compensation | - | - | - | - | - | 150,000 | 355,088 | - | - | - | 355,088 | |||||||||||||||||||||||||||||||||
| Preferred Return at 8% for Class A Units | - | - | 962,163 | - | - | - | - | - | - | - | 962,163 | |||||||||||||||||||||||||||||||||
| Net Loss | - | - | - | - | - | - | - | - | (31,366,517 | ) | (2,801,965 | ) | (34,168,482 | ) | ||||||||||||||||||||||||||||||
| MEMBERS' DEFICIT, September 30, 2021 | 43,000,000 | $ | 41,764,270 | $ | 6,594,660 | 8,000,000 | $ | 1,520,000 | 1,925,833 | $ | 1,227,960 | $ | (180,000 | ) | $ | (203,942,517 | ) | $ | (26,231,059 | ) | $ | (179,246,686 | ) | |||||||||||||||||||||
| Three Months Ended | ||||||||||||||||||||||||||||||||||||||||||||
| Class A | Class B-1 | Class C | Redemption of | Controlling | Non-Controlling | Total | ||||||||||||||||||||||||||||||||||||||
| Units | Amount | Preferred Return | Units | Amount | Units | Amount | Class C Units | Interests | Interests | Members' Deficit | ||||||||||||||||||||||||||||||||||
| MEMBERS' DEFICIT, June 30, 2020 | 43,000,000 | $ | 41,764,270 | $ | 2,124,278 | 6,000,000 | $ | 1,140,000 | 1,052,083 | $ | 379,751 | $ | (180,000 | ) | $ | (96,195,133 | ) | $ | (18,206,330 | ) | $ | (69,173,164 | ) | |||||||||||||||||||||
| Class B-1 and Class C Unit Based Compensation | - | - | - | - | - | 225,000 | 52,670 | - | - | - | 52,670 | |||||||||||||||||||||||||||||||||
| Redemption of Class C Units | - | - | - | - | - | - | - | - | - | - | - | |||||||||||||||||||||||||||||||||
| Preferred Return at 8% for Class A Units | - | - | 840,805 | - | - | - | - | - | - | - | 840,805 | |||||||||||||||||||||||||||||||||
| Net Income (Loss) | - | - | - | - | - | - | - | - | (16,706,718 | ) | 875,560 | (15,831,158 | ) | |||||||||||||||||||||||||||||||
| MEMBERS' DEFICIT, September 30, 2020 | 43,000,000 | $ | 41,764,270 | $ | 2,965,083 | 6,000,000 | $ | 1,140,000 | 1,277,083 | $ | 432,421 | $ | (180,000 | ) | $ | (112,901,852 | ) | $ | (17,330,770 | ) | $ | (84,110,848 | ) | |||||||||||||||||||||
| Nine Months Ended | ||||||||||||||||||||||||||||||||||||||||||||
| Class A | Class B-1 | Class C | Redemption of | Controlling | Non-Controlling | Total | ||||||||||||||||||||||||||||||||||||||
| Units | Amount | Preferred Return | Units | Amount | Units | Amount | Class C Units | Interests | Interests | Members' Deficit | ||||||||||||||||||||||||||||||||||
| MEMBERS' DEFICIT, December 31, 2020 | 43,000,000 | 41,764,270 | 3,815,041 | 6,000,000 | $ | 1,140,000 | 1,302,083 | $ | 228,560 | $ | (180,000 | ) | $ | (126,242,225 | ) | $ | (18,187,381 | ) | $ | (97,661,735 | ) | |||||||||||||||||||||||
| Class B-1 and Class C Unit Based Compensation | - | - | - | 2,000,000 | 380,000 | 623,750 | 999,400 | - | - | - | 1,379,400 | |||||||||||||||||||||||||||||||||
| Preferred Return at 8% for Class A Units | - | - | 2,779,619 | - | - | - | - | - | - | - | 2,779,619 | |||||||||||||||||||||||||||||||||
| Net Loss | - | - | - | - | - | - | - | - | (77,700,292 | ) | (8,043,678 | ) | (85,743,970 | ) | ||||||||||||||||||||||||||||||
| MEMBERS' DEFICIT, September 30, 2021 | 43,000,000 | $ | 41,764,270 | $ | 6,594,660 | 8,000,000 | $ | 1,520,000 | 1,925,833 | $ | 1,227,960 | $ | (180,000 | ) | $ | (203,942,517 | ) | $ | (26,231,059 | ) | $ | (179,246,686 | ) | |||||||||||||||||||||
| Nine Months Ended | ||||||||||||||||||||||||||||||||||||||||||||
| Class A | Class B-1 | Class C | Redemption of | Controlling | Non-Controlling | Total | ||||||||||||||||||||||||||||||||||||||
| Units | Amount | Preferred Return | Units | Amount | Units | Amount | Class C Units | Interests | Interests | Members' Deficit | ||||||||||||||||||||||||||||||||||
| MEMBERS' DEFICIT, December 31, 2019 | 43,000,000 | $ | 41,764,270 | $ | 430,230 | 4,000,000 | $ | 760,000 | 1,058,333 | $ | 161,093 | $ | - | $ | (85,167,716 | ) | $ | (13,880,310 | ) | $ | (55,932,433 | ) | ||||||||||||||||||||||
| Class B-1 and Class C Unit Based Compensation | - | - | - | 2,000,000 | 380,000 | 418,750 | 271,328 | - | - | - | 651,328 | |||||||||||||||||||||||||||||||||
| Redemption of Class C Units | - | - | - | - | - | (200,000 | ) | - | (180,000 | ) | - | - | (180,000 | ) | ||||||||||||||||||||||||||||||
| Preferred Return at 8% for Class A Units | - | - | 2,534,853 | - | - | - | - | - | - | - | 2,534,853 | |||||||||||||||||||||||||||||||||
| Net Loss | - | - | - | - | - | - | - | - | (27,734,136 | ) | (3,450,460 | ) | (31,184,596 | ) | ||||||||||||||||||||||||||||||
| MEMBERS' DEFICIT, September 30, 2020 | 43,000,000 | $ | 41,764,270 | $ | 2,965,083 | 6,000,000 | $ | 1,140,000 | 1,277,083 | $ | 432,421 | $ | (180,000 | ) | $ | (112,901,852 | ) | $ | (17,330,770 | ) | $ | (84,110,848 | ) | |||||||||||||||||||||
See Accompanying Notes to Condensed Consolidated Financial Statements
4
P3 HEALTH GROUP HOLDINGS, LLC and SUBSIDIARIES
CONDENSED CONSOLIDATED STATEMENTS OF CASH FLOWS (UNAUDITED)
| Nine Months Ended September 30, | ||||||||
| 2021 | 2020 | |||||||
| Net Loss | $ | (85,743,970 | ) | $ | (31,184,596 | ) | ||
| Adjustments to Reconcile Net Loss to Cash Used in Operations: | ||||||||
| Depreciation Expense | 1,218,796 | 613,329 | ||||||
| Stock-Based Compensation | 1,379,400 | 651,329 | ||||||
| Class A and Class D Preferred Returns | 6,107,441 | 5,577,812 | ||||||
| Amortization of Discount from Issuance of Debt | 931,958 | - | ||||||
| Mark-to-Market Adjustment for Class D Warrants | 12,063,265 | - | ||||||
| Amortization of Debt Origination Fees | 525,783 | - | ||||||
| Net Change in ROU Assets and Liabilities | 379,235 | (57,496 | ) | |||||
| Premium Deficiency Reserve | 4,600,000 | (1,304,962 | ) | |||||
| Changes in Assets and Liabilities: | ||||||||
| Accounts Receivable, Net | 54,602 | (477,983 | ) | |||||
| Health Plan Settlements Receivable / Premiums Receivable | (7,417,477 | ) | (22,312,352 | ) | ||||
| Other Current Assets | 2,667,427 | (53,293 | ) | |||||
| Accounts Payable and Accrued Expenses | 3,606,729 | 5,822,494 | ||||||
| Accrued Payroll | (1,842,877 | ) | 1,644,954 | |||||
| Accrued Interest | 3,952,044 | 1,201,458 | ||||||
| Health Plan Settlements Payable | (483,657 | ) | 938,965 | |||||
| Claims Payable | 18,173,851 | 32,295,208 | ||||||
| Net Cash Used in Operations | (39,827,450 | ) | (6,645,131 | ) | ||||
| Investing Activities: | ||||||||
| Purchases of Property, Plant and Equipment | (2,990,130 | ) | (2,232,652 | ) | ||||
| Acquisitions | (5,014,500 | ) | - | |||||
| Notes Receivable, Net | 120,463 | 336,130 | ||||||
| Net Cash Used in Investing Activities | (7,884,167 | ) | (1,896,521 | ) | ||||
| Financing Activities: | ||||||||
| Issuance (Redemption) of Member Units | - | (180,000 | ) | |||||
| Issuance of Long-Term Debt | 12,750,000 | 158,134 | ||||||
| Repayment of Long-Term and Short-Term Debt | (67,216 | ) | - | |||||
| Loan Origination and Closing Fees | (191,250 | ) | - | |||||
| Net Cash Provided by (Used In) Financing Activities | 12,491,534 | (21,866 | ) | |||||
| Net Change in Cash and Restricted Cash | (35,220,083 | ) | (8,563,519 | ) | ||||
| Cash and Restricted Cash at Beginning of Period | 39,902,947 | 32,904,847 | ||||||
| Cash and Restricted Cash at End of Period | $ | 4,682,864 | $ | 24,341,328 | ||||
| Supplemental Disclosures of Cash Flow Information: | ||||||||
| Cash Paid for Interest | 1,707,705 | 312,185 | ||||||
| Accrued Costs for Internally Developed Technology (in Process) | 123,027 | - | ||||||
See Accompanying Notes to Condensed Consolidated Financial Statements
5
P3 HEALTH GROUP HOLDINGS, LLC and SUBSIDIARIES
NOTES TO CONDENSED CONSOLIDATED FINANCIAL STATEMENTS (UNAUDITED)
FOR THE THREE AND NINE MONTHS ENDED SEPTEMBER 30, 2021 and 2020
Note 1: Company Operations
P3 Health Group Holdings, LLC and Subsidiaries (“P3” or “the Company” or “Holdings”) was founded on April 12, 2017 and began commercial operations on April 20, 2017 to provide population health management services on an at-risk basis to insurance plans offering medical coverage to Medicare beneficiaries under Medicare Advantage (“MA”) programs. MA programs are insurance products created solely for Medicare beneficiaries. Insurance plans contract directly with the Centers for Medicare and Medicaid Services (“CMS”) to offer Medicare beneficiaries benefits that replace traditional Medicare Fee for Service (“FFS”) coverage.
The Company’s contracts with health plans are based on an at-risk shared savings model. Under this model, the Company is financially responsible for the cost of all contractually-covered services provided to members assigned to the Company by health plans in exchange for a fixed monthly “capitation” payment, which is generally a percentage of the payment health plans receive from CMS. Under this arrangement, Medicare beneficiaries generally receive all their healthcare coverage through the Company’s network of employed and affiliated physicians and specialists (except for emergency situations).
The services provided to health plans’ members vary by contract. These may include utilization management, care management, disease education, and maintenance of a quality improvement and quality management program for members assigned to the Company. Effective January 1, 2019, the Company is also responsible for the credentialing of Company providers, processing and payment of claims and the establishment of a provider network for certain health plans. At September 30, 2021 and December 31, 2020, P3 had agreements with fourteen and twelve health plans, respectively.
The initial terms of the Company’s existing health plan contracts currently extend from periods ending December 31, 2022 through December 31, 2025. After the initial term, most health plan agreements automatically renew for various terms (usually one to two years) unless either party notifies the other, in writing, of its intent not to renew in advance based on contractually obligated notification periods. Failure of the Company to retain certain health plan contracts would have a material adverse impact on operating results.
The Company has Management Services Agreements (“MSAs”) and deficit funding agreements with Kahan, Wakefield, Abdou, PLLC and Bacchus, Wakefield, Kahan, PC (collectively, the “Network”). The MSAs provide that P3 Health Partners-Nevada, LLC will furnish administrative personnel, office supplies and equipment, general business services, contract negotiation and billing and collection services to the Network. Fees for these services are the excess of the Network’s revenue over expenses. Per the deficit agreement, P3 Health Partners-Nevada, LLC will lend amounts to the Network to the extent expenses exceed revenue(s). The loan bears interest at prime plus 2%.
In addition to P3’s contracts with health plans, through its relationship with the Network, the Company provides primary healthcare services through its employed physician clinic locations. These primary care clinics are reimbursed for services provided under FFS contracts with various payers and through capitated – per member, per month (“PMPM”) arrangements.
6
P3 HEALTH GROUP HOLDINGS, LLC and SUBSIDIARIES
NOTES TO CONDENSED CONSOLIDATED FINANCIAL STATEMENTS (UNAUDITED)
FOR THE THREE AND NINE MONTHS ENDED SEPTEMBER 30, 2021 and 2020
Note 2: Significant Accounting Policies
Basis of Presentation
These accompanying, interim condensed consolidated financial statements are prepared in accordance with Financial Accounting Standards Board (“FASB”) Accounting Standard Codification (“ASC”) 954-205, Health Care Entities – Presentation of Financial Statements in conformity with Generally Accepted Accounting Principles in the United States of America (“GAAP”). In the opinion of Management, all material adjustments of a normal recurring nature have been made to present fairly the Company’s financial position as of September 30, 2021 and the results of operations and cash flows for the periods presented.
Principles of Consolidation
These accompanying condensed consolidated financial statements include the accounts of P3 Health Group Holdings, LLC (“Holdings”) and its six wholly-owned subsidiaries: P3 Health Group Management, LLC (“P3-MGMT”); P3 Consulting, LLC (“P3-CS”); P3 Health Partners, LLC (P3 Health Partners-Arizona, LLC, “P3-AZ”); P3 Health Partners-Nevada, LLC (“P3-NV”); P3 Health Partners-Oregon, LLC (“P3-OR”); and P3 Health Partners-Florida, LLC (“P3-FL”). P3 Health Partners ACO, LLC (Arizona Connected Care “AzCC”) is a wholly owned subsidiary of P3-AZ.
The financial statements of Kahan, Wakefield, Abdou, PLLC (“KWA”); and Bacchus, Wakefield, Kahan, PC (“BACC”) are consolidated with P3-NV. P3-NV is the primary beneficiary of these entities due to management services and deficit funding agreements in place among them, see Note 1.
On August 22, 2019, P3-AZ was assigned all the equity in AzCC for no consideration. The assets, liabilities, and operating activity of AzCC as of the assignment date are included in the Company’s condensed consolidated financial statements.
All significant transactions among these entities have been eliminated in consolidation.
Variable Interest Entities (“VIE” or “VIEs”)
Management analyzes whether (or not) the Company has any financial interests in VIEs. This analysis includes a qualitative review based on an evaluation of the design of the entity, its organizational structure, including decision making ability and financial agreements, as well as a quantitative review. ASC 810, Variable Interest Entities and Principles of Consolidation requires a reporting entity to consolidate a VIE when that reporting entity has a variable interest that provides it with a controlling financial interest in the VIE. The entity which consolidates a VIE is referred to as the primary beneficiary of the VIE. See Note 18 pertaining to VIEs.
7
P3 HEALTH GROUP HOLDINGS, LLC and SUBSIDIARIES
NOTES TO CONDENSED CONSOLIDATED FINANCIAL STATEMENTS (UNAUDITED)
FOR THE THREE AND NINE MONTHS ENDED SEPTEMBER 30, 2021 and 2020
Management’s Use of Estimates
Preparation of these condensed consolidated financial statements and accompanying footnotes, in conformity with U.S. GAAP, requires Management to make estimates and assumptions that could affect amounts reported here. Management bases its estimates on the best information available at the time, its experiences and various other assumptions believed to be reasonable under the circumstances including estimates of the impact of COVID-19. The areas where significant estimates are used in these accompanying financial statements include revenue recognition, the liability for unpaid claims, unit-based compensation, premium deficiency reserves and impairment recognition of long-lived assets (including intangibles and goodwill). Actual results could differ from those estimates.
Cash and Restricted Cash
Cash includes deposits made at banks. Accounts at each institution are insured up to $250,000 by the Federal Deposit Insurance Corporation (“FDIC”). In 2021 and 2020, the Company maintained its cash in bank deposit accounts which, at times, may have exceeded FDIC insured limits. Management does not expect any losses to occur on such accounts.
Financial instruments that potentially subject the Company to concentrations of credit risk consist principally of cash deposits. As of September 30, 2021, and December 31, 2020, the Company had unrestricted cash of $4,336,565 and $36,261,104, respectively, deposited at banking institutions which exceeded the FDIC insured limit.
| Unaudited | ||||||||
| Type of Account | September 30, 2021 | December 31, 2020 | ||||||
| Checking | $ | 4,336,565 | $ | 36,261,104 | ||||
| Restricted | 346,299 | 3,641,843 | ||||||
| Total Cash Balances | $ | 4,682,864 | $ | 39,902,947 | ||||
Restricted Cash is that which is held for a specific purpose (such as payment of partner distributions and legal settlements) and is thus not available to the Company for immediate or general business use. Restricted Cash appears as a separate line item on the Company's condensed consolidated balance sheets.
Revenue Recognition and Revenue Sources
The following tables depict the sources (by product type) from which the Company’s revenues are derived:
| Three Months Ended September 30, | ||||||||||||||||
| Revenue Type | 2021 | % of Total | 2020 | % of Total | ||||||||||||
| Capitated Revenue | $ | 152,276,992 | 97 | % | $ | 124,461,275 | 97 | % | ||||||||
| Other Patient Service Revenue | ||||||||||||||||
| Clinical Fees & Insurance Revenue | 2,408,642 | 2 | % | 1,947,109 | 2 | % | ||||||||||
| Shared Risk Revenue | 139,331 | 0 | % | 416,765 | 0 | % | ||||||||||
| Care Coordination / Management Fees | 1,146,355 | 1 | % | 1,115,895 | 1 | % | ||||||||||
| Incentive Fees | 548,935 | 0 | % | 899,946 | 1 | % | ||||||||||
| Subtotal Other Patient Service Revenue | 4,243,263 | 3 | % | 4,379,716 | 3 | % | ||||||||||
| Total Revenue | $ | 156,520,255 | 100 | % | $ | 128,840,991 | 100 | % | ||||||||
8
P3 HEALTH GROUP HOLDINGS, LLC and SUBSIDIARIES
NOTES TO CONDENSED CONSOLIDATED FINANCIAL STATEMENTS (UNAUDITED)
FOR THE THREE AND NINE MONTHS ENDED SEPTEMBER 30, 2021 and 2020
| Nine Months Ended September 30, | ||||||||||||||||
| Revenue Type | 2021 | % of Total | 2020 | % of Total | ||||||||||||
| Capitated Revenue | $ | 447,137,121 | 97 | % | $ | 351,018,290 | 97 | % | ||||||||
| Other Patient Service Revenue | ||||||||||||||||
| Clinical Fees & Insurance Revenue | 7,280,789 | 2 | % | 4,895,956 | 1 | % | ||||||||||
| Shared Risk Revenue | 341,342 | 0 | % | 416,765 | 0 | % | ||||||||||
| Care Coordination / Management Fees | 2,994,755 | 1 | % | 2,312,840 | 1 | % | ||||||||||
| Incentive Fees | 1,749,225 | 0 | % | 2,020,429 | 1 | % | ||||||||||
| Subtotal Other Patient Service Revenue | 12,366,111 | 3 | % | 9,645,990 | 3 | % | ||||||||||
| Total Revenue | $ | 459,503,232 | 100 | % | $ | 360,664,280 | 100 | % | ||||||||
The following tables depict the individual health plans from which the Company has a concentration of revenue that is 10.0%, or more:
| Three Months Ended September 30, | ||||||||||||||||
| 2021 | % of Total | 2020 | % of Total | |||||||||||||
| Health Plan A | $ | 36,417,184 | 23 | % | $ | 35,838,768 | 28 | % | ||||||||
| Health Plan B | 38,227,530 | 24 | % | 27,666,559 | 21 | % | ||||||||||
| Health Plan C | 29,563,741 | 19 | % | 16,638,058 | 13 | % | ||||||||||
| Health Plan D | 18,913,641 | 12 | % | 21,599,026 | 17 | % | ||||||||||
| All Other | 33,398,159 | 21 | % | 27,098,580 | 21 | % | ||||||||||
| Total Revenue | $ | 156,520,255 | 100 | % | $ | 128,840,991 | 100 | % | ||||||||
| Nine Months Ended September 30, | ||||||||||||||||
| 2021 | % of Total | 2020 | % of Total | |||||||||||||
| Health Plan A | $ | 114,230,860 | 25 | % | $ | 107,265,350 | 31 | % | ||||||||
| Health Plan B | 105,261,569 | 23 | % | 80,813,324 | 22 | % | ||||||||||
| Health Plan C | 84,489,621 | 18 | % | 47,061,035 | 13 | % | ||||||||||
| Health Plan D | 56,606,725 | 12 | % | 48,750,247 | 14 | % | ||||||||||
| All Other | 98,914,457 | 22 | % | 76,774,323 | 20 | % | ||||||||||
| Total Revenue | $ | 459,503,232 | 100 | % | $ | 360,664,280 | 100 | % | ||||||||
Revenue Recognition
The Company applies the framework prescribed according to ASC 606, Revenue from Contracts with Customers (“ASC 606”), to recognize revenue. The core principle of ASC 606 is that an entity’s performance obligation is complete, and revenue is earned, upon the transfer of a promise to deliver services to customers commensurate with consideration to which it would expect to be received in exchange for the actual delivery of those services. The terms of the contract and all relevant facts and circumstances should be considered when applying this guidance. This includes application of a practical expedient (a “portfolio approach”) to contracts with similar characteristics and circumstances. P3 used the portfolio approach to account for any ASC 606 transition adjustments for revenue from its MA contracted health plans.
9
P3 HEALTH GROUP HOLDINGS, LLC and SUBSIDIARIES
NOTES TO CONDENSED CONSOLIDATED FINANCIAL STATEMENTS (UNAUDITED)
FOR THE THREE AND NINE MONTHS ENDED SEPTEMBER 30, 2021 and 2020
The principles of ASC 606 are generally applied using the following five steps:
| 1. | Identify the contract(s) with a customer. |
| 2. | Identify the performance obligations in the contract. |
| 3. | Determine the transaction price. |
| 4. | Allocate the transaction price to the performance obligations in the contract; and |
| 5. | Recognize revenue when (or as) the entity satisfies a performance obligation. |
The guidance requires disclosures related to the nature, amount, timing, and uncertainty of revenue that is recognized. The Company initially applied the standard on January 1, 2019, using the modified retrospective adoption method, and elected to apply the modified retrospective method only to contracts that were not completed as of this date. This modified retrospective application did not have a material impact on the Company’s December 31, 2018 retained earnings (deficit). Additionally, the Company utilized the portfolio approach to group contracts together with similar characteristics for the adoption analysis.
Capitated Revenue
The Company contracts with health plans using an at-risk (shared savings) model. Under the at-risk model, P3 is responsible for the cost of all covered services provided to members assigned by the health plans to the Company in exchange for a fixed payment, which generally is a percentage of the payment (“POP”) based on health plans’ premiums received from CMS. Through this capitation arrangement, P3 stands ready to provide assigned MA beneficiaries all their medical care via the Company’s directly employed and affiliated physician/specialist network.
The premiums health plans receive are determined via a competitive bidding process with CMS and are based on the costs of care in local markets and the average utilization of services by patients enrolled. Medicare pays capitation using a “risk adjustment model”, which compensates providers based on the health status (acuity) of each individual patient. MA plans with higher acuity patients receive higher premiums. Conversely, MA plans with lower acuity patients receive lesser premiums. Under the risk adjustment model, capitation is paid on an interim basis based on enrollee data submitted for the preceding year and is adjusted in subsequent periods after final data is compiled. As premiums are adjusted via this risk adjustment model (via a Risk Adjustment Factor, “RAF”), the Company’s PMPM payments will change commensurately with how our contracted MA plans’ premiums change with CMS. Management determined the transaction price for these contracts is variable as it primarily includes PMPM fees which can fluctuate throughout the course of the year based on the acuity of each individual enrollee. Capitated accounts receivable includes $301,602 and $1,174,916 as of September 30, 2021 and December 31, 2020, respectively, for acuity-related adjustments that are estimated to be received in subsequent periods. These amounts are included in Health Plan Settlement Receivables. In certain contracts, PMPM fees also include adjustments for items such as performance incentives or penalties based on the achievement of certain clinical quality metrics as contracted with payors.
10
P3 HEALTH GROUP HOLDINGS, LLC and SUBSIDIARIES
NOTES TO CONDENSED CONSOLIDATED FINANCIAL STATEMENTS (UNAUDITED)
FOR THE THREE AND NINE MONTHS ENDED SEPTEMBER 30, 2021 and 2020
Capitated revenues are recognized based on an estimated PMPM transaction price to transfer the service for a distinct increment of the series (e.g. month) and is recognized net of projected acuity adjustments and performance incentives or penalties as Management can reasonably estimate the ultimate PMPM payment of those contracts. The Company recognizes revenue in the month in which eligible members are entitled to receive healthcare benefits during the contract term. The capitation amount is subject to possible retroactive premium risk adjustments based on the member’s individual acuity. As the period between the time of service and time of payment is typically one year or less, Management elected the practical expedient under ASC 606-10-32-18 and did not adjust for the effects of a significant financing component.
P3’s contracts with health plans may include core functions and services for managing assigned patients’ medical care. The combination of those services is offered as one “single solution” (“bundle”). The Company does not offer nor price each individual function as a standalone a la carte service to health plans. However, the addition or exclusion of certain services may be negotiated and reflected in each health plan’s specific total POP.
As of September 30, 2021, and December 31, 2020, P3 had POP contracts in effect with fourteen and twelve health plans (both across four states), respectively.
11
P3 HEALTH GROUP HOLDINGS, LLC and SUBSIDIARIES
NOTES TO CONDENSED CONSOLIDATED FINANCIAL STATEMENTS (UNAUDITED)
FOR THE THREE AND NINE MONTHS ENDED SEPTEMBER 30, 2021 and 2020
Each month, in accordance with contractual obligations (for non-delegated health plans, e.g. – those for which the Company has not been delegated for claims processing), each plan funds a medical claims payment reserve equal to a defined percentage of premium attributable to members assigned P3. In turn, P3 administers and funds medical claims for contractually covered services, for assigned health plan members, from that health plan’s reserve. On a quarterly or monthly basis, health plans conduct a settlement of the reserve to determine any surplus or deficit amount. The reconciliation and distribution of the reserve occur within 120-days following the end of each quarter. An annual settlement reconciliation and distribution from all funds occurs within twenty-one months following each year-end. At September 30, 2021 and December 31, 2020, settlement receivables (health plan surpluses) and settlement payables (health plan deficits), by health plan, by period, were as follows:
| Health Plan Name | September 30, 2021 | December 31, 2020 | ||||||
| Health Plan A | $ | 838,428 | $ | 94,501 | ||||
| Health Plan B | 18,853,480 | 15,766,808 | ||||||
| Health Plan C | 9,010,871 | 7,332,687 | ||||||
| Health Plan D | 7,933,506 | 6,863,270 | ||||||
| Health Plan E | 1,135,398 | 1,429,722 | ||||||
| Health Plan F | 3,236,511 | 3,222,247 | ||||||
| Health Plan G | 239,375 | 2,748,622 | ||||||
| Health Plan H | 2,124,913 | 428,755 | ||||||
| Health Plan I | 250,591 | 17,908 | ||||||
| Health Plan J | 136,586 | 141,922 | ||||||
| Health Plan K | - | 4,569 | ||||||
| Health Plan L | 174,859 | 378,822 | ||||||
| Health Plan N | 1,912,792 | - | ||||||
| Total Health Plan Settlement Receivables | $ | 45,847,310 | $ | 38,429,833 | ||||
| Health Plan Name | September 30, 2021 | December 31, 2020 | ||||||
| Health Plan C | $ | 191,179 | $ | 1,928,414 | ||||
| Health Plan D | 4,680,185 | 4,680,185 | ||||||
| Health Plan F | 7,294,784 | 6,125,681 | ||||||
| Health Plan G | 703,095 | 1,008,495 | ||||||
| Health Plan I | 166,956 | - | ||||||
| Health Plan M | 222,919 | - | ||||||
| Total Health Plan Settlement Payables by Year | $ | 13,259,118 | $ | 13,742,775 | ||||
At September 30, 2021, and December 31, 2020, Management has deemed the Company’s settlement receivables to be fully collectible from those health plans where P3 is not delegated for claims processing. Accordingly, an allowance for doubtful accounts is not necessary.
Other Patient Service Revenue(s) – Clinical Fees and Insurance Revenue
Clinic fees and insurance revenues relate to net patient fees received from various payers and direct patients (“self-payers”) under contracts in which P3’s sole performance obligation is to provide healthcare services through the operation of medical clinics. The Company recognizes clinic fees and insurance revenue in the period in which services are provided, on the date of service, under FFS payment arrangements or in the month assigned health plan members are entitled to services. P3’s performance obligations are typically satisfied in the same day services are provided. All the Company’s contracts with its customers under these arrangements include a single performance obligation.
12
P3 HEALTH GROUP HOLDINGS, LLC and SUBSIDIARIES
NOTES TO CONDENSED CONSOLIDATED FINANCIAL STATEMENTS (UNAUDITED)
FOR THE THREE AND NINE MONTHS ENDED SEPTEMBER 30, 2021 and 2020
P3’s contractual relationships with patients, in most cases, also involve third-party payers (Medicare, Medicaid, managed care health plans and commercial insurance companies, including plans offered through state-sponsored health insurance exchanges). Transaction prices for services provided are dependent upon specific rules in place with third party payers – specifically, Medicare/Medicaid and pre-negotiated rates with managed care health plans and commercial insurance companies. Contractual arrangements with third parties typically include payments at amounts which are less than standard charges. These charges generally have predetermined rates for diagnostic service codes or discounted FFS rates. Management perpetually reviews P3’s contractual estimation processes to consider and incorporate updates to laws, regulations and frequent changes in the managed care system. Contractual terms are negotiated and updated accordingly upon renewal.
The Company’s revenue is based upon the estimated amounts Management expects to receive from patients and third-party payers. Estimates of explicit price concessions under managed care and commercial insurance plans are tied to payment terms specified in related contractual agreements. Retroactively calculated explicit price concessions tied to reimbursement agreements with third-party payers are recognized on an estimated basis in the period related services are rendered and adjusted in future periods as final payments are received. Revenue related to uninsured patients, uninsured co-payments, and deductibles (for patients with healthcare coverage) may also be discounted. P3 records implicit price concessions (based on historical collection experience) related to uninsured accounts to recognize self-pay revenues at their most likely amounts to be collected.
As part of the adoption of ASC 606, Management elected two of the available practical expedients provided for by the standard. First, the Company did not adjust the transaction price for any financing components as those were deemed to be insignificant. Additionally, the Company expensed all incremental customer contract acquisition costs as incurred as such costs are not material and would be amortized over a period less than one year.
Other Patient Service Revenue(s) – Shared Risk Revenue
The Company (via one of its wholly owned subsidiaries – Arizona Connected Care, “AzCC”) receives 30% of the shared risk savings from parties with whom it contracts under four separate arrangements. These arrangements are driven solely by medical cost containment year-over-year (“YoY”) expense reductions. This key performance indicator (“KPI”) is measured by the aggregate change in PMPY (per member, per year medical costs. If the sequential YoY PMPY aggregate change yields a reduction, the Company receives 30% of the associated total cost savings for that year. Conversely, if the sequential YoY PMPY aggregate change yields an increase in medical costs, no monies are due the Company that year. This KPI is compiled and reviewed on a calendar year basis.
Other Patient Service Revenue(s) – Care Coordination Fees and Management Fees
P3’s delegated health plans may also pay a Care Coordination Fee (“CCF”) or Management Fee to the Company. CCFs and Management Fees are intended to fund the costs of delegated services provided to certain health plans. CCFs are specifically identified and separated in each monthly capitation payment the Company receives from these parties. None of the Company’s other health plans bifurcate CCFs nor are any of them contractually required to do so.
13
P3 HEALTH GROUP HOLDINGS, LLC and SUBSIDIARIES
NOTES TO CONDENSED CONSOLIDATED FINANCIAL STATEMENTS (UNAUDITED)
FOR THE THREE AND NINE MONTHS ENDED SEPTEMBER 30, 2021 and 2020
The Company uses a portfolio approach to account for CCFs and Management Fees. Based on similarities of the terms of the care coordination and administrative services, Management believes that revenue recognized by utilizing the portfolio approach approximates that which it would have realized if an individual contract approach were applied.
Other Patient Service Revenue(s) – Incentive Fees
Certain health plans with whom the Company contracts pay incentives to P3 when KPIs are positive and exemplary. KPIs may include high patient satisfaction; extraordinary quality of care; P3’s contribution to health plans’ Star Rating(s); and P3’s net promoter score (“NPS”) – among a variety of others. Incentive Fees are realized upon the Company’s receipt of cash, as the amounts are constrained by the discretion of health plans.
Patient Fees Receivable
Substantially, all client fees and insurance receivables are due under FFS contracts with third party payors, such as commercial insurance companies (“Commercial”), government-sponsored healthcare programs (“Medicare/Medicaid”) or directly from patients (“Self-Pay”). Management continuously monitors activities from payors (including patients) and records an estimated price concession based on specific contracts and actual historical collection patterns. Patient fees receivable, where a third-party payor is responsible for the amount due, are carried at amounts determined by the original charges for services provided less explicit price concessions. Price concessions represent amounts made for contractual adjustments (discounts). Patient fees receivable are included in Clinic Fees and Insurance Receivables in the Company’s Condensed Consolidated Balance Sheets and are recorded net of contractual allowances.
Patient fees receivable are recorded at the invoiced amount, net of any expected contractual adjustments and implicit price concessions, and do not bear interest. The Company has agreements with third-party payors that provide for payments at amounts different from the established rates. Payment arrangements include prospectively determined rates per discharge, reimbursed costs, discounted charges, and per diem payments. Patient service revenues are reported at the estimated net realizable amounts from patients, third-party payors, and others for services rendered. Contractual adjustments arising under reimbursement arrangements with third-party payors are accrued on an estimated basis in the period the related services are rendered and are adjusted in future periods as final settlements are determined. Implicit price concessions are taken based on historical collection experience and reflect the estimated amounts the Company expects to collect.
Property, Plant and Equipment (“PP&E”)
PP&E is carried at acquisition cost, net of accumulated depreciation. Costs for repairs and maintenance of PP&E, after such PP&E has been placed in service, are expensed as incurred. Costs and related accumulated depreciation are eliminated when PP&E is sold or otherwise disposed. Sales and disposals may result in asset-specific gains or losses. Any such gains or losses are included as a component to net income (loss). Management computes and records depreciation using the straight-line method. The following table summarizes the estimated useful lives applicable to PP&E:
14
P3 HEALTH GROUP HOLDINGS, LLC and SUBSIDIARIES
NOTES TO CONDENSED CONSOLIDATED FINANCIAL STATEMENTS (UNAUDITED)
FOR THE THREE AND NINE MONTHS ENDED SEPTEMBER 30, 2021 and 2020
| Classification PP&E Asset | Depreciation Cycle | |
| Leasehold Improvements (Cycle: Lease Term) | Lease Term | |
| Furniture & Fixtures | 7-Years | |
| Computer Equipment | 3-Years | |
| Medical Equipment | 7-Years | |
| Software | 3-Years | |
| Software (Development in Process) | N/A |
ASC 350-40, Accounting for Internal Use Software, outlines how companies should capitalize or expense internal-use software, based on achieving two key objectives. The first objective includes ensuring that the Preliminary Project Stage has been completed and the second one being the type of work being completed within the Application Development Stage, which qualifies as a capitalizable activity.
Computer software is considered for internal use when it is developed or purchased for the internal usage and needs of the organization only.
Beginning in 2018, P3 began the project build of its own proprietary technology to serve core functions of its business operations such as revenue and medical cost analysis, care management and various facets that promote impactful utilization. At September 30, 2021 and December 31,2020, the Company has categorized $2,272,560 and $2,794,221, respectively to Property, Plant and Equipment (“PP&E”) for these software costs (specifically to work in progress).
P3’s internally-developed technology has been and is continuing to be designed to standardize the availability of quality data used across the enterprise. The technology requires several components of external input from health plans served by P3, its provider network and member-patient populations.
As internally developed technology is deemed “substantially complete”, it is placed into service and depreciated. At September 30, 2021, and December 31, 2020, $2,411,278 and $534,931, of capitalized costs was placed into service, respectively. Any, and all, costs associated with internally developed technology, following deployment are expensed directly to the Company’s Condensed Consolidated Statements of Operations, as incurred.
Impairment of Long-Lived Assets
In accordance with ASC 360, Property, Plant, and Equipment (“PP&E”) – Impairment or Disposal of Long-Lived Assets, the Company reviews its long-lived assets for impairment whenever events or changes in circumstances indicate their carrying amounts may not be recoverable. Recoverability of an asset or asset group is measured by comparing its’ carrying amount to the future undiscounted net cash flows the asset or asset group is expected to generate. If such assets are considered impaired (e.g. – future undiscounted cash flows are less than net book value), an impairment charge is recognized. Assets to be disposed of are reported at the lower of the carrying amount or fair value less costs to sell. To date, the Company has not retired nor sold any PP&E.
15
P3 HEALTH GROUP HOLDINGS, LLC and SUBSIDIARIES
NOTES TO CONDENSED CONSOLIDATED FINANCIAL STATEMENTS (UNAUDITED)
FOR THE THREE AND NINE MONTHS ENDED SEPTEMBER 30, 2021 and 2020
Goodwill
In accordance with ASC 350, Goodwill and Other – Accounting for Goodwill, Management has elected to test goodwill for impairment at the Company level. Goodwill is tested for impairment on, at least, an annual basis or more frequently if a known triggering event occurs. If a triggering event occurs, the fair value of goodwill may decrease below its’ carrying amount. On the occurrence of a triggering event, an entity has the option to first assess qualitative factors at the “macro” level (Step 0) to determine whether a quantitative impairment test (Step 1) is necessary. If Step 0 indicates it’s more likely than not that goodwill is impaired, Management must proceed with Step 1 to quantify the current fair value differential below the carrying amount. If the qualitative assessment indicates it’s more likely than not that goodwill is not impaired, no further testing is needed. The Company has not recorded any goodwill impairment charges in 2020 or 2021.
Leases
The Company accounts for its leases under ASC 842 Leases. In accordance with ASC 842, the Company, at the inception of the contract, determines whether a contract is or contains a lease. For leases with terms greater than 12 months, the Company records the related operating or finance right of use asset and lease liability at the present value of lease payments over the lease term. The Company is generally not able to readily determine the implicit rate in the lease and therefore uses the determined incremental borrowing rate at lease commencement to compute the present value of lease payments. The incremental borrowing rate represents an estimate of the market interest rate the Company would incur at lease commencement to borrow an amount equal to the lease payments on a collateralized basis over the term of a lease. Renewal options are not included in the measurement of the right of use assets and lease liabilities unless the Company is reasonably certain to exercise the optional renewal periods. Some leases also include early termination options, which can be exercised under specific conditions. Additionally, certain leases contain incentives, such as construction allowances from landlords. These incentives reduce the right-of-use asset related to the lease.
Some of the Company's leases contain rent escalations over the lease term. The Company recognizes expense for operating leases on a straight-line basis over the lease term. The Company does not currently have any finance leases. The Company’s lease agreements contain variable payments for common area maintenance and utilities. The Company has elected the practical expedient to combine lease and non-lease components for all asset categories. Therefore, the lease payments used to measure the lease liability for these leases include fixed minimum rentals along with fixed non lease component charges. The Company does not have significant residual value guarantees or restrictive covenants in its lease portfolio.
Business Combinations
In accordance with ASC 805, Business Combinations, the price tendered in business acquisitions is allocated among the identifiable tangible and intangible assets and assumed liabilities - all of which are based on estimates of corresponding fair value as of the acquisition date. Management applies valuation methods which are ultimately used in the Company’s purchase price allocations. Goodwill is recorded based on the difference between the fair value of consideration exchanged and the fair value of the net assets and liabilities assumed.
16
P3 HEALTH GROUP HOLDINGS, LLC and SUBSIDIARIES
NOTES TO CONDENSED CONSOLIDATED FINANCIAL STATEMENTS (UNAUDITED)
FOR THE THREE AND NINE MONTHS ENDED SEPTEMBER 30, 2021 and 2020
Equity-Based Compensation
Under P3’s unit-based incentive plan, the Company may reward grantees with various types of awards, including but not limited to profits interests on a service-based or performance-based schedule. These awards may also contain market conditions.
For performance-vesting units, P3 recognizes unit-based compensation expense when it is probable that the underlying performance condition will be achieved. The Company will analyze if a performance condition is probable for each reporting period through the settlement date for awards subject to performance vesting.
For service-vesting units, P3 recognizes unit-based compensation expense over the requisite service period for each separately vesting portion of the profits interest as if the award was, in substance, multiple awards. Some service awards vest monthly whereby the Company recognizes associated compensation expense in equal installments throughout the course of the year.
The Company’s Management Incentive Plan, which became effective as of December 8, 2017 and which P3’s Board of Managers, (the “Board”) amended and restated on April 16, 2020 (the “Incentive Plan”), provides for the grant of service-based and performance-based incentive units to certain officers, directors, and employees. Subject to adjustment, a maximum aggregate of 6,845,297 incentive units are authorized for issuance under the Incentive Plan. Incentive unit awards are governed by the terms of the Incentive Plan, the terms of the award agreement documenting the grant and the limited liability company agreement of P3 Health Group Holdings, LLC (the “LLC Agreement”), and are intended to qualify as a “profits interest” for Federal income tax purposes.
Warrant Liability
The Company accounts for warrant units of the Company’s Class D Units that may become redeemable for cash or other assets as liabilities at fair value on the Condensed Consolidated Balance Sheets. The warrants are subject to remeasurement at each balance sheet date and any change in fair value is recognized in the Company’s Condensed Consolidated Statements of Operations. Changes in the estimated fair value of the warrants are recognized as a non-cash gain or loss. The fair value of the warrants was estimated using an Option Pricing model (Black-Scholes-Merton).
The Company utilizes the Black-Scholes-Merton methodology to value the warrants at each reporting period, with changes in fair value recognized in the Condensed Consolidated Statements of Operations. The estimated fair value of the warrant liability is determined using Level 1 and Level 3 inputs. The key assumptions used in the option pricing model relate to expected share-price volatility, expected term, and the risk-free interest rate. The expected volatility was derived from the asset volatilities of a selected group of comparable public companies. The risk-free interest rate is based on U.S. Treasury zero coupon bond rates. The expected term of the warrants is assumed to be the time until the close of the Transaction discussed in Note 19.
17
P3 HEALTH GROUP HOLDINGS, LLC and SUBSIDIARIES
NOTES TO CONDENSED CONSOLIDATED FINANCIAL STATEMENTS (UNAUDITED)
FOR THE THREE AND NINE MONTHS ENDED SEPTEMBER 30, 2021 and 2020
The key inputs into the option pricing model at September 30, 2021, and December 31, 2020 were as follows:
| Key Input | September 30, 2021 | December 31, 2020 | ||||||
| Volatility | 60.00 | % | 65.00 | % | ||||
| Risk-Free Interest Rate | 0.09 | % | 0.10 | % | ||||
| Exercise Price | $ | 4.68 | $ | 4.68 | ||||
| Expected Term | 1.0 Years | 1.1 Years | ||||||
Premium Deficiency Reserve (“PDR”)
In accordance with ASC 944-60-25-4, a PDR is required when there is a probable loss on unearned premiums. PDR is recognized when the unearned premium reserve is insufficient to cover the existing books of business. If a PDR exists, the amount shall be recognized by recording an additional liability for the deficiency with a corresponding charge to operations. As of September 30, 2021, the Company had accrued a $4,600,000 PDR to its Condensed Consolidated Balance Sheet.
Healthcare Services Expense and Claims Payable (collectively, “Medical Expenses”)
The cost of healthcare services is recognized in the period services are provided. This also includes an estimate of the cost of services that have been incurred, but not yet reported (“IBNR”). Medical expenses also include costs for overseeing the quality of care and programs, which focus on patient wellness. Additionally, healthcare expenses can also include, from time to time, remediation of certain claims that might result from periodic reviews conducted by various regulatory agencies.
A reserve for unpaid health claims is reported as IBNR. IBNR is based on historical paid claims trends and healthcare utilization metrics and available industry data. IBNR is recorded as “Claims Payable” in the accompanying condensed consolidated balance sheets. The Company recorded $75,108,251 and $56,934,400 of IBNR liabilities to its Condensed Consolidated Balance Sheets at September 30, 2021 and December 31, 2020, respectively.
Management estimates the Company’s IBNR by applying standard actuarial methodologies, which utilize historical data, including the period between the date services are rendered and the date claims received (and paid), denied claims activity, expected medical cost inflation, seasonality patterns, and changes in membership mix. IBNR estimates are made on an accrual basis and adjusted in future periods as required. Any adjustments to prior period estimates are included in the current period. Such estimates are subject to the impact from changes in both the regulatory and economic environments. The Company’s claims payable represents Management’s best estimate of its liability for unpaid medical costs as of September 30, 2021 and December 31, 2020.
Income
Taxes
The Company and its wholly owned subsidiaries are “Single Member” limited liability companies (“LLCs”) and, therefore,
do not directly pay Federal income tax expense(s), except for P3 Health Group Management, LLC (“P3-MGMT”), which has elected
to file as a C-Corp under the Internal Revenue Code. However, P3-MGMT – although subject to Federal income tax, has historically
not paid any such taxes due to loss carryforwards.
18
P3 HEALTH GROUP HOLDINGS, LLC and SUBSIDIARIES
NOTES TO CONDENSED CONSOLIDATED FINANCIAL STATEMENTS (UNAUDITED)
FOR THE THREE AND NINE MONTHS ENDED SEPTEMBER 30, 2021 and 2020
Management evaluates the Company’s potential for any uncertain tax positions. This is done on a continual basis throughout the course of the year. This is accomplished through a review of policies and procedures, reviews of customary and regular tax filings, and discussions with third-party experts. The Company did not have any uncertain tax positions at September 30, 2021 nor December 31, 2020.
As an LLC, the Company files annual Federal partnership income tax returns in the United States and in and in certain states and local jurisdictions. No returns are closed to assessment based on the inception date of the Company (2017). Interest and penalties, if any, would be recorded as a component of operating expenses.
Sales and Marketing Expenses
The Company uses advertising primarily to promote the health plans with whom it conducts business as well as its physician clinics throughout the geographic areas it serves. Advertising costs are charged directly to operations as incurred. Sales and Marketing Expenses totaled $491,418 and $278,663 for the three months ended September 30, 2021 and 2020, respectively. Sales and Marketing Expenses totaled $1,118,160 and $631,073 for the nine months ended September 30, 2021 and 2020, respectively.
Note 3: Recent Accounting Pronouncements Not Yet Adopted
In October 2018, the FASB issued ASU 2018-17, Consolidation – Targeted Improvements to Related Party Guidance for Variable Interest Entities (Topic 810) (“ASU 2018-17”). ASU 2018-17 eliminates the requirement that entities consider indirect interests held through related parties under common control in their entirety when assessing whether a decision-making fee is a variable interest. Instead, the reporting entity will consider such indirect interests on a proportionate basis. ASU 2018-17 is effective for the Company for fiscal years beginning after December 15, 2020, and interim periods within fiscal years beginning after December 15, 2021. All entities are required to apply the adjustments in ASU 2018-17 retrospectively with a cumulative-effect adjustment to retained earnings at the beginning of the earliest period presented. Early adoption is permitted. The Company is currently evaluating the impact this standard will have on its condensed consolidated financial statements and related disclosures.
In June 2016, the FASB issued ASU 2016-13, Financial Instruments – Credit Losses (Topic 326): Measurement of Credit Losses on Financial Instruments (“ASU 2016-13”). ASU 2016-13 introduces a new model for recognizing credit losses on financial instruments based on an estimate of current expected credit losses. The guidance is effective the Company beginning January 1, 2023. The new current expected credit losses (“CECL”) model generally calls for the immediate recognition of all expected credit losses and applies to loans, accounts and trade receivables as well as other financial assets measured at amortized cost, loan commitments and off-balance sheet credit exposures, debt securities and other financial assets measured at fair value through other comprehensive income, and beneficial interests in securitized financial assets. The new guidance replaces the current incurred loss model for measuring expected credit losses, requires expected losses on available for sale debt securities to be recognized through an allowance for credit losses rather than as reductions in the amortized cost of the securities, and provides for additional disclosure requirements. The Company is currently evaluating the impact the adoption of this standard will have on its condensed consolidated financial statements.
19
P3 HEALTH GROUP HOLDINGS, LLC and SUBSIDIARIES
NOTES TO CONDENSED CONSOLIDATED FINANCIAL STATEMENTS (UNAUDITED)
FOR THE THREE AND NINE MONTHS ENDED SEPTEMBER 30, 2021 and 2020
Note 4: Company Liquidity, Operations and Management’s Plans
The Company follows guidance promulgated by the FASB, specifically, ASC 205-40, Presentation of Financial Statements – Going Concern, which requires Management to assess P3’s ability to continue as a going concern and to provide related disclosure(s) in certain circumstances.
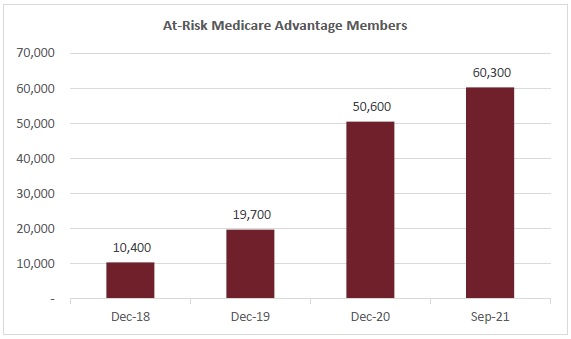
The Company has experienced revenue growth in 2019, 2020 and the nine months ended September 30, 2021 due to contracting with six new health plans in 2019, five additional new health plans in 2020, and two additional health plans in 2021.
| Year | # Health Plans | Revenue | YoY Growth | Net Loss | Net Loss % | ||||||||||||||||
| 2018 | 1 | $ | 87,696,695 | N/A | $ | (49,774,013 | ) | -56.8 | % | ||||||||||||
| 2019 | 7 | 145,894,832 | 66 | % | (42,916,855 | ) | -29.4 | % | |||||||||||||
| 2020 | 12 | 485,541,288 | 233 | % | (45,381,578 | ) | -9.3 | % | |||||||||||||
| September 2020 YTD | 12 | 360,664,280 | N/A | (31,184,596 | ) | -8.6 | % | ||||||||||||||
| September 2021 YTD | 14 | 459,503,232 | 27 | % | (85,743,970 | ) | -18.7 | % | |||||||||||||
On November 19, 2020, the Company entered a Term Loan Agreement with CRG Servicing, LLC (“CRG”) (the “Agreement”) to provide additional Net Working Capital (“NWC”) of up to $100.0 million limited to three total and tri-annual draws ($40.0 million in year 1, $35.0 million in year 2 and $25.0 million in year 3). Draws totaling $52.8 million have been made ($40.0 million in 2020, year 1, and $12.8 million in 2021, year 2) as of September 30, 2021. Per the terms of the Agreement, the Company may draw down an additional $47.2 million of funding from CRG – limited to $22.2 million in 2021 (year 2) and $25.0 million in 2022 (year 3).
The Company’s Agreement with CRG requires compliance with certain financial covenants. Financial covenants require the Company to always maintain minimum liquidity, as defined in the agreement, of $5.0 million and annual consolidated revenue of, at least, $395.0 million for 2021. Although the Company’s revenue covenant is annual, P3 posted consolidated revenue of $459.5 million in the nine months ended September 30, 2021. For certain days in September 2021, minimum liquidity for the Company, as defined in the Agreement, fell below $5.0 million. The Company has obtained a waiver of the debt covenant violation that occurred on those days. Also, upon close of the Transaction referenced in Note 19, the Company expects to receive $180.0 million in net proceeds, which will be used to fund its operations and working capital.
The Company believes it has sufficient, and available, cash resources to continue operating as a going concern and to be compliant with its debt covenants over the next 12-month period.
20
P3 HEALTH GROUP HOLDINGS, LLC and SUBSIDIARIES
NOTES TO CONDENSED CONSOLIDATED FINANCIAL STATEMENTS (UNAUDITED)
FOR THE THREE AND NINE MONTHS ENDED SEPTEMBER 30, 2021 and 2020
As the Company continues to pursue its business plan, it may need to finance its operations through a combination of public or private equity or debt financings or other capital sources. However, there can be no assurance that any additional financing or strategic transactions will be available to the Company on acceptable terms, if at all. If events or circumstances occur such that the Company does not obtain additional funding, this could have a material adverse effect on the Company’s business, results of operations or financial condition.
Note 5: Patient Fees Receivable
Patient fees receivable is included in Clinic Fees and Insurance Receivables in the Company’s Condensed Consolidated Balance Sheets and consisted of the following categories for each of the periods ended September 30, 2021 and December 31, 2020, presented below:
| Unaudited | ||||||||
| September 30, 2021 | December 31, 2020 | |||||||
| Total Receivables: Gross | $ | 2,098,575 | $ | 662,526 | ||||
| Less: Contractual Allowances | (1,799,004 | ) | (302,137 | ) | ||||
| Receivables Net of Contractual Allowances | 299,571 | 360,389 | ||||||
| Commercial | 129,742 | 203,201 | ||||||
| Medicare / Medicaid | 147,635 | 109,996 | ||||||
| Self Pay | 22,194 | 47,192 | ||||||
| Receivables Net of Contractual Allowances | $ | 299,571 | $ | 360,389 | ||||
Note 6: Property, Plant and Equipment (“PP&E”)
The Company’s PP&E balances as of September 30, 2021 and December 31, 2020 consisted of the following:
| Unaudited | ||||||||
| Classification PP&E Asset | September 30, 2021 | December 31, 2020 | ||||||
| Leasehold Improvements (Cycle: Lease Term) | $ | 2,135,982 | $ | 1,392,688 | ||||
| Furniture & Fixtures | 1,511,151 | 1,150,789 | ||||||
| Computer Equipment & Software | 4,234,995 | 1,947,894 | ||||||
| Medical Equipment | 578,849 | 457,822 | ||||||
| Software (Development in Process) | 2,272,560 | 2,794,221 | ||||||
| Less: Accumulated Depreciation | (2,811,623 | ) | (1,592,827 | ) | ||||
| Totals | $ | 7,921,914 | $ | 6,150,587 | ||||
Note 7: Business Acquisitions
The Company makes acquisitions to expand its geographical footprint and member base. The following acquisitions have been accounted for as business combinations.
The amounts presented for the 2021 acquired Intangible Assets are based on their estimated fair value at the date of acquisition. These estimates, and their corresponding amortization expense will be finalized by December 31, 2021.
21
P3 HEALTH GROUP HOLDINGS, LLC and SUBSIDIARIES
NOTES TO CONDENSED CONSOLIDATED FINANCIAL STATEMENTS (UNAUDITED)
FOR THE THREE AND NINE MONTHS ENDED SEPTEMBER 30, 2021 and 2020
Michael F. Hamant, M.D., P.C.
On October 30, 2020, the Company purchased a medical practice, Michael F. Hamant, M.D., P.C. The purchase price totaled $140,000 paid in cash, $20,000 of which was for transaction fees.
The total purchase price has been allocated to PP&E and Goodwill. The following table provides an allocation of the total purchase price:
| Goodwill | $ | 130,000 | ||
| PP&E | 10,000 | |||
| Total Purchase Price | $ | 140,000 |
Robert E. Mutterperl, D.O., S.C.
On April 5, 2021, the Company purchased a medical practice, Robert E. Mutterperl, D.O., S.C. The purchase price totaled $85,000 paid in cash, $3,000 of which was for transaction fees.
$82,000 of the total purchase price has been allocated to Goodwill.
Neisa I. Diaz, M.D., LLC
On July 1, 2021, the Company purchased a medical practice, Neisa I. Diaz, M.D. LLC. The total purchase price was $3,802,037, which was paid in cash. The total purchase price has been allocated to Acquired Intangibles (representing the present value of existing payor contracts, with an estimated economic life of 10 years), other assets and goodwill. The following table provides a preliminary allocation of the total purchase price:
| Aquired Intangibles | $ | 1,840,000 | ||
| Goodwill | 1,960,000 | |||
| Other Assets | 2,037 | |||
| Total Purchase Price | $ | 3,802,037 |
Medical Associates of Tampa Bay, LLC
On September 3, 2021, the Company purchased a medical practice, Medical Associates of Tampa Bay, LLC. The total purchase price was $1,154,000, which was paid in cash. The total purchase price has been allocated to acquired intangible assets (representing the present value of payor contracts, with an estimated economic life of 10 years), PP&E, and Goodwill. The following table provides a preliminary allocation of the total purchase price:
| Aquired Intangibles | $ | 240,000 | ||
| Goodwill | 892,550 | |||
| PP&E | 21,450 | |||
| Total Purchase Price | $ | 1,154,000 |
22
P3 HEALTH GROUP HOLDINGS, LLC and SUBSIDIARIES
NOTES TO CONDENSED CONSOLIDATED FINANCIAL STATEMENTS (UNAUDITED)
FOR THE THREE AND NINE MONTHS ENDED SEPTEMBER 30, 2021 and 2020
A summary of Goodwill and Other Intangibles is as follows:
| September 30, 2021 | December 31, 2020 | |||||||
| Goodwill | $ | 3,805,628 | $ | 871,128 | ||||
| Intangible Assets - Amortizable | 2,080,000 | - | ||||||
| Total | $ | 5,885,628 | $ | 871,128 | ||||
Note 8: Notes Receivable, Net
The Company entered into five Promissory Notes (the “Notes”) with three family medical practices (the “Practices”) to fund working capital needs. The Company simultaneously entered separate Provider Agreements with each Practice related to four of these five Notes. Each Provider Agreement establishes a preferred, predetermined reimbursement rate for services rendered to the Company’s members and requires that Practice to furnish healthcare services to the Company’s members. The Provider Agreements mature in concert with each practice’s loan. In accordance with each of these four Notes, so long as the corresponding Provider Agreement is in effect on the maturity date of each Note and has not been terminated by the borrower for any reason, the Company will forgive the entire principal, plus accrued interest due on the date of maturity. Likewise, if the Company terminates the Provider Agreement prior to maturity without cause, all principal plus accrued interest due from the borrower will be forgiven. Upon early termination of the Provider Agreement by borrower, all principal and accrued interest will become immediately payable and due the Company. Related to potential forgiveness, the Company records a valuation allowance on a straight-line basis following the early termination date through the date of maturity, due to the probable likelihood of needing to forgive the notes at maturity, with a full valuation allowance set at the time of maturity.
At September 30, 2021 and December 31, 2020, the Company has recorded notes receivable of $4,027,598 and $4,000,629, including accrued interest of $795,318 and $572,382, and net of valuation allowances of $343,399 and $195,967, respectively. The Notes carry maturity dates ranging from December 31, 2021 through December 31, 2028 with interest rates ranging from 5.0% to 10.0%. The short-term components, $343,399 and $174,499, as of September 30, 2021 and December 31, 2020, of these Notes is included in Other Receivables in the Company’s Condensed Consolidated Balance Sheets.
23
P3 HEALTH GROUP HOLDINGS, LLC and SUBSIDIARIES
NOTES TO CONDENSED CONSOLIDATED FINANCIAL STATEMENTS (UNAUDITED)
FOR THE THREE AND NINE MONTHS ENDED SEPTEMBER 30, 2021 and 2020
Note 9: Claims Payable
Claims payable includes claims reported as of the balance sheet date, including estimates for IBNR, due to third parties for health care services provided to members. IBNR was $75,108,251 and $54,472,498 at September 30, 2021 and 2020, respectively. Activity in the liability for claims payable and healthcare expenses for the nine months ended September 30, was as follows:
| For the Nine Months Ended September 30, | ||||||||
| 2021 | 2020 | |||||||
| Claims Unpaid, Beginning of Year | $ | 56,934,400 | $ | 19,859,348 | ||||
| Incurred, Related to: | ||||||||
| Current Year | 418,149,443 | 295,275,661 | ||||||
| Prior Year(s) | (1,921,074 | ) | - | |||||
| Total Incurred | 416,228,369 | 295,275,661 | ||||||
| Paid, Related to: | ||||||||
| Current Year | 337,014,904 | 243,942,253 | ||||||
| Prior Year(s) | 61,039,614 | 19,038,200 | ||||||
| Total Paid | 398,054,518 | 262,980,453 | ||||||
| Claims Unpaid, End of Period | $ | 75,108,251 | $ | 52,154,556 | ||||
Total incurred claims of $416,228,369 and $295,275,661 for the nine months ended September 30, 2021 and 2020 respectively are lower than total Medical Expenses by $43,004,716 and $52,982,611 respectively. This difference is primarily composed of Medicare Part D expenses, Sub-Capitation expenses, and other non-claims payable medical expenses on the accompanying Condensed Consolidated Statements of Operations. Estimates for incurred claims are based on historical enrollment and cost trends while also taking into consideration operational changes. Future and actual results typically differ from estimates. Differences could result from an overall change in medical expenses per member, changes in member mix or simply due to the addition of new members.
Note 10: Long-Term Debt
In 2019, the Company received bridge loans (“LTD-A”) from some of its existing investors totaling $16,164,914. The bridge loans accrued interest at 12% and were scheduled to mature on November 12, 2019. All but one was repaid with proceeds raised from the issuance of Class D Units. The remaining and outstanding bridge loan balance was $1,629,310, plus accrued interest of $219,236 and was fully paid by November 30, 2020.
In 2019, the Company executed a share repurchase agreement with one of its investors (“LTD-C”). The agreement stipulated $15.0 million originally contributed by the investor would be repaid by the earlier of June 28, 2023 or a change in control transaction. As part of this repurchase agreement, the investor exchanged its owned units back for a $15.0 million note receivable from the Company – thus, no longer holding its former equity position. The note carries interest of 10.0% per year. Its principal balance plus accrued interest is due at maturity in 2023. Accrued interest was $5,316,338 and $3,865,740 at September 30, 2021, and December 31, 2020, respectively. The total principal balances are included in Long-Term Debt on the Company’s Condensed Consolidated Balance Sheets at September 30, 2021 and December 31, 2020.
24
P3 HEALTH GROUP HOLDINGS, LLC and SUBSIDIARIES
NOTES TO CONDENSED CONSOLIDATED FINANCIAL STATEMENTS (UNAUDITED)
FOR THE THREE AND NINE MONTHS ENDED SEPTEMBER 30, 2021 and 2020
On November 19, 2020, the Company entered a Term Loan and Security Agreement (the “Facility”) with a commercial lender (“LTD-D”). The Facility provides funding up to $100.0 million, of which $52.8 million has been drawn as of September 30, 2021. Of the $52.8 million drawn, $36.5 million was received on November 19, 2020 (net of $3.5 million in financing costs) and $12.6 million was received on June 28, 2021 (net of $0.2 million in financing costs). Financing costs are amortized on a straight-line basis through the Facility’s expected maturity date. The Facility may be used to pay certain indebtedness of the Company and for general working capital needs. The Company has access to an additional $47.3 million (of which $22.3 million may be drawn up through December 31, 2021 and $25.0 million, which may be drawn up through February 28, 2022). Repayment of principal of all amounts drawn are due at maturity.
The Company must meet a borrowing base milestone by demonstrating to the Lenders that revenue for any three consecutive month period (ending after the Facility’s closing date, but on or prior to December 31, 2021) is greater than or equal to $125.0 million. Additionally, the Company must remain in compliance with financial covenants such as minimum liquidity of $5.0 million and annual minimum revenue levels. For certain days in September 2021, minimum liquidity for the Company, as defined in the Agreement, fell below $5.0 million. The Company has obtained a waiver of the debt covenant violation that occurred on those days. Starting in 2021, and on an annual basis thereafter, the Company must post a minimum amount of annual revenue equal to, or greater than $395.0 million; increasing to $460.0 million in 2022; $525.0 million in 2023; $585.0 million in 2024 and $650.0 million in 2025. Also, the Company is subject to certain restrictions that include indebtedness and liens.
The Facility’s maturity date is December 31, 2025. This maturity date may be accelerated as a remedy under the certain default provisions in the agreement or in the event a mandatory prepayment trigger occurs. Interest is payable at 12.0% per annum on a quarterly cycle (in arrears) beginning March 31, 2021. Management may elect to pay the full 12.0% in cash or at 8.0% with the remaining 4.0% being added to principal as “paid in kind” (“PIK”) for a period of three years (or twelve payments). The PIK is subject to acceleration as of that date in the event certain occurrences in the Facility’s agreement are triggered. The Facility’s Lenders also received ten-year warrants to purchase 858,351 shares of Series D Preferred Units at $4.68 per share. These warrants have been recorded as a liability in the Company’s Condensed Consolidated Balance Sheets at fair market value and are marked to market on a quarterly basis until exercised. A discount was recorded on the debt issued for the same amount. The discount is amortized through maturity of the loan.
The Security Agreement provides the Lenders collateral in 100% of the Company’s pledged stock, its subsidiaries (including tangible and intangible personal property) and bank accounts.
On June 7, 2020, the Company repurchased 200,000 Class C (Time-based) Units, at $0.90 per Unit from a former Executive through issuance of a long-term note (“LTD-E”). This repurchase was recognized in the Company’s condensed consolidated balance sheets as a reduction to Members’ Deficit in the amount of $180,000 and a corresponding increase in Long term Debt. LTD-E bears interest of 3.25% and fixed monthly payments of $7,757 through date of maturity (June 7, 2022). At September 30, 2021, the remaining balance due on LTD-E has been recorded as Current Portion of Long-Term Debt in the Company’s Condensed Consolidated Balance Sheets given its maturity date is within 12-months.
25
P3 HEALTH GROUP HOLDINGS, LLC and SUBSIDIARIES
NOTES TO CONDENSED CONSOLIDATED FINANCIAL STATEMENTS (UNAUDITED)
FOR THE THREE AND NINE MONTHS ENDED SEPTEMBER 30, 2021 and 2020
The following table rolls forward the long-term debt balances presented in the Company’s Condensed Consolidated Balance Sheets:
| LTD-A | LTD-B | LTD-C | LTD-D | LTD-E | Totals | |||||||||||||||||||
| Balance at December 31, 2019 | $ | 1,516,598 | $ | - | $ | 15,000,000 | $ | - | $ | - | $ | 16,516,598 | ||||||||||||
| Issued in 2020 | - | - | - | 40,000,000 | 180,000 | 40,180,000 | ||||||||||||||||||
| Principal Payments in 2020 | (1,516,598 | ) | - | - | - | (43,911 | ) | (1,560,509 | ) | |||||||||||||||
| Balance at December 31 , 2020 | $ | - | $ | - | $ | 15,000,000 | $ | 40,000,000 | $ | 136,089 | $ | 55,136,089 | ||||||||||||
| Issued in 2021 | - | - | - | 12,750,000 | - | 12,750,000 | ||||||||||||||||||
| Principal Payments in 2021 | - | - | - | - | (67,216 | ) | (67,216 | ) | ||||||||||||||||
| Balance at September 30, 2021 | $ | - | $ | - | $ | 15,000,000 | $ | 52,750,000 | $ | 68,873 | $ | 67,818,873 | ||||||||||||
Beginning on September 30, 2021 and for the full years presented below thereafter, the Company’s annual, minimum payments due under debt obligations were as follows:
| Interest | ||||||||||||||||
| Principal | PIK | Total Payments* | Total
Remaining Cash Payments | |||||||||||||
| 2021 | $ | 30,508 | $ | 1,056,761 | $ | 3,241,713 | $ | 2,215,459 | ||||||||
| 2022 | 38,365 | 4,414,502 | 8,878,819 | 4,502,683 | ||||||||||||
| 2023 | 15,000,000 | 4,734,115 | 14,669,197 | 29,991,066 | ||||||||||||
| 2024 | - | 2,448,480 | 7,230,729 | 4,782,249 | ||||||||||||
| 2025 | 52,750,000 | 2,336,432 | 14,093,910 | 69,180,343 | ||||||||||||
| Total | $ | 67,818,873 | $ | 14,990,290 | $ | 48,114,368 | $ | 110,671,800 | ||||||||
*Total Interest Payments Remaining Cash and Non-Cash (PIK)
| Unaudited | ||||||||
| September 30, 2021 | December 31, 2020 | |||||||
| Total Principal | $ | 67,818,873 | $ | 55,136,089 | ||||
| Less: Current Portion of Long-Term Debt | (68,873 | ) | (89,988 | ) | ||||
| Less: Loan Origination Fees | (3,757,969 | ) | (3,566,718 | ) | ||||
| Add: Accum. Amortizaton of Loan Origination Fees | 606,020 | 80,237 | ||||||
| Less: Discount for Issuance of Class D Warrants | (6,316,605 | ) | (6,316,605 | ) | ||||
| Add: Accum. Amortization of Class D Warrants | 1,076,929 | 144,972 | ||||||
| Long Term Debt | $ | 59,358,375 | $ | 45,387,986 | ||||
Note 11: Capitalization and Management Incentive Units
P3's capital structure consists of Class A Units, which represent commitments from the Company’s private equity sponsors, Class B Units, which represent founders’ common equity, Class C Units, which represent Management Incentive Units, and Class D Units, which represents an additional investment from a private equity sponsor.
Class A Units
At December 31, 2019, the Company has received total funding commitments from its Class A Unit holders totaling $43.0 million. Class A Units have voting rights and, whether, or not declared or approved by the Board, the holders of Class A Units accrue a preferred return in the amount of 8.0%, per annum (beginning on November 19, 2019). At September 30, 2021 and December 31, 2020, there were 43,000,000 Class A Units authorized and outstanding.
26
P3 HEALTH GROUP HOLDINGS, LLC and SUBSIDIARIES
NOTES TO CONDENSED CONSOLIDATED FINANCIAL STATEMENTS (UNAUDITED)
FOR THE THREE AND NINE MONTHS ENDED SEPTEMBER 30, 2021 and 2020
Class B Units
Class B Units are those, which have been issued to the Company’s Founders. Class B Units are subdivided among three tranches: Subclass B-1; Subclass B-2; and Subclass B-3. Each Subclass is described below:
| · | Subclass B-1 (10,000,000 Units): Subclass B-1 Units are entirely service based (Time-based). 20% of Subclass B-1 Units vest each year beginning on April 20, 2018 and annually thereafter until April 20, 2022. Subclass B-1 Units very closely resemble Class C Time-based Profits Interest(s) Units. |
| · | Subclass B-2 (4,054,054): Subclass B-2 Units are entirely Performance-based. 100% of Subclass B-2 Units vest immediately prior to and conditioned upon the occurrence of a Sale of the Company in which the Company’s EBITDA as of the date of such Sale of the Company is at least $20 million or net proceeds distributable among the Members from such Sale of the Company are at least $200 million. |
| · | Subclass B-3 (5,647,438): Subclass B-3 Units are entirely performance-based. 100% of Subclass B-3 Units shall vest immediately prior to and conditioned upon the occurrence of a Sale of the Company in which the Company’s EBITDA as of the date of such Sale of the Company is at least $30 million or net proceeds distributable among the members from such Sale of the company are at least $300 million. |
At September 30, 2021 and December 31, 2020, there were 19,701,492 Class B Units (all Subclasses) authorized and issued.
Of this 19,701,492, there were 8,000,000 and 6,000,000 Subclass B-1 Units vested as of September 30, 2021 and December 31, 2020, respectively. Only vested units are presented in the Condensed Consolidated Statements of Changes in Members’ Deficit. As of September 30, 2021, 2,000,000 Subclass B-1 Units remain unvested. Pursuant to the performance hurdles for Subclass B-2 Units and Subclass B-3 Units, for which both Subclasses are conditioned on a “Sale of the Company,” none of these issued units have vested (to date).
Class C Units (6,845,297 Authorized)
P3 has a Management Incentive Plan (the “Plan”), which provides for the grant of service-based and performance-based Class C Units to board managers and key employees. Subject to adjustment, a maximum aggregate of 6,845,297 Class C Units have been authorized for issuance under the Plan. Class C Units are governed by the terms of the Plan, the terms of the award agreement documenting the grant and the Limited Liability Company agreement of Holdings (the “LLC Agreement”). Class C Units are intended to qualify as “Profits Interests” for Federal income tax purposes.
27
P3 HEALTH GROUP HOLDINGS, LLC and SUBSIDIARIES
NOTES TO CONDENSED CONSOLIDATED FINANCIAL STATEMENTS (UNAUDITED)
FOR THE THREE AND NINE MONTHS ENDED SEPTEMBER 30, 2021 and 2020
Service-based Class C Units generally vest, except as otherwise approved by P3’s Board, over a period of four to five years, with ratable vesting each year following twelve months of continued employment or service with the balance vesting in equal annual installments over the remaining and required service period, provided the grantee continues to be employed by, or provide service to, P3 and be employed on the applicable vesting anniversary date.
Performance-based Class C Units vest upon the Company’s attainment of certain Board-established milestones (thresholds). Board-established milestones are grant specific and set on the date of each Class C Unit grant.
P3’s Board may accelerate the vesting of any Class C incentive units granted under the Plan at such times and upon such terms and conditions as may be deemed advisable, for which any determination can be made on a grant-specific basis. At September 30, 2021 and December 31, 2020, the number of Class C Units issued were 5,485,833 (of which, 1,925,833 were vested) and 5,420,833 (of which 1,302,083 were vested), respectively, and only the vested units are presented in the Condensed Consolidated Statements of Changes in Members’ Deficit (See also Note 11 “Share Based Compensation”).
Class D Units Subject to Possible Redemption
On November 14, 2019, P3 received $50.0 million in funding from Hudson Vegas Investment, SPV, LLC, an investment vehicle of The Straus Group (“Straus”) per the unit purchase agreement executed between the parties. P3 issued Straus 16,130,034 of Class D Units. Class D Units have voting rights and, accrue a preferred return in the amount of 8.0%, per annum. This funding was and is intended to support ongoing operations for the Company. Of the $50.0 million received from Straus, the Company utilized $16,752,354 to settle outstanding bridge loans and $2,958,446 to settle transaction closing costs related to Class D Units. These transaction closing costs were netted against the $50.0 million in proceeds raised.
There are 16,130,034 Class D Units authorized and outstanding at September 30, 2021 and December 31, 2020.
Class D units contain a provision whereby at any time after November 4, 2024, the holders of Class D Units could exercise a right that would require the Company to redeem their outstanding units for cash, if certain conditions related to a sale of the Company are not met. Upon exercise of this right, the Company would be required to redeem all the then outstanding Class D units at a price equal to the amount of proceeds that otherwise would have been received in a sale transaction. In accordance ASC 480-10-S99, Distinguishing Liabilities from Equity (“ASC 480”), redemption provisions not solely within the control of the Company require the associated equity instruments to be classified outside of permanent equity. As such, the Class D units have been presented outside of permanent equity. The Company has concluded it is not probable that the conditional redemption feature will be exercised, as significant uncertainties exist that indicate the redemption will not occur, which include the merger transaction discussed in Note 18; therefore, Class D shares are recorded at initial fair value, plus accrued preferred returns.
28
P3 HEALTH GROUP HOLDINGS, LLC and SUBSIDIARIES
NOTES TO CONDENSED CONSOLIDATED FINANCIAL STATEMENTS (UNAUDITED)
FOR THE THREE AND NINE MONTHS ENDED SEPTEMBER 30, 2021 and 2020
Distributions to the Company's unitholders are made according to the following priority:
| · | First, to Class D Unitholders in proportion to their unreturned contribution amounts and until each Class D Member’s unreturned contribution amount is reduced to zero. |
| · | Second, to Class A Unitholders in proportion to their unreturned contribution amount and until each Class A Member’s unreturned contribution amount is reduced to zero. |
| · | Third, to Class A and Class D Unitholders in proportion to their respective unpaid preferred return balances have been reduced to zero; and |
| · | Thereafter, any remaining amounts to holders of all vested units, in proportion to their number of vested units. |
Note 12: Share-Based Compensation
In 2017, the Company’s Board adopted an Equity Incentive Plan (the “Plan”). Under the Plan, the Company may grant awards in the form of Profits Interests to employees, officers, and directors up to a maximum aggregate of 6,845,297 Class C Units. Awards under the Plan are granted on a discretionary basis and are subject to the approval of the Company’s Board.
During the nine months ended September 30, 2021 and 2020, the Company entered into grant agreements awarding a total of 1,045,000 and 1,550,000 Class C Units, respectively. These Profits Interests represent profits interest ownership in the Company tied solely to the accretion, if any, in the value of the Company following the date of issuance of such Profits Interests. Profits Interests participate in any increase of the Company value related to their profits interests after the hurdle value has been achieved and the Company’s Profits Interests receive the agreed-upon return on their invested capital.
Profits Interest awards generally vest either over a requisite service period or are contingent upon a performance hurdle.
Each Profits Interest award contains the following general and material terms:
| · | The Profits Interests receive distributions only upon a liquidity event, as defined by a sale of the Company, that exceeds a threshold equivalent to the fair value of the enterprise, as determined by P3’s Board of Directors, at the grant date. |
| · | A portion of the awards vest over a period of continuous employment or service (“Time-Based Units”) while the other portion of the awards only vest in the event of the Sponsor’s Exit (“Performance-Based Units”), as defined by the Plan. The Time-Based Units provide for accelerated vesting upon Sponsor’s Exit should the participant’s employment be terminated (other than for cause) after the Sponsor’s Exit, but prior to the final service vesting date. |
29
P3 HEALTH GROUP HOLDINGS, LLC and SUBSIDIARIES
NOTES TO CONDENSED CONSOLIDATED FINANCIAL STATEMENTS (UNAUDITED)
FOR THE THREE AND NINE MONTHS ENDED SEPTEMBER 30, 2021 and 2020
All awards include a repurchase option at the election of the Company for the vested portion upon termination of employment or service. Profits Interests are accounted for as equity using the fair value method, which requires the measurement and recognition of compensation expense for all profit interest-based payment awards made to the Company’s employees based upon the grant-date fair value. The Company has concluded both Time-Based Units and Performance-Based Units are subject to a market condition and has assessed the market condition as part of its determination of the grant date fair value. Service-Based Units also include Subclass B-1 Units which are Time-Based.
The following is a summary of Performance-Based Profits Interest(s) awards outstanding, by grant year and corresponding hurdle value ranges as of, and for the periods ended, December 31, 2018 through 2020, and September 30, 2021:
| Year | Units | Performance Hurdle Summary / Ranges | |||
| 2018 | 500,000 | Liquidation or Sale of Company; $120 Million to $300 Million | |||
| 2019 | 1,125,000 | Liquidation or Sale of Company; $294 Million | |||
| 2020 | 950,000 | Liquidation or Sale of Company; $294 Million to $900 Million | |||
| 2021 | 60,000 | Sale or Equity Transfer of Company; Total Enterprise Value $500 Million | |||
For Performance-Based Units, the Company recognizes compensation expense when it is probable a performance hurdle would be achieved. Management analyzed whether (or not) the hurdles of each related Performance-Based grant was probable during the reporting periods presented. Since vesting is, in all cases, tied to a sale or liquidation of the Company, Management deemed the achievement of the performance hurdle not probable during the periods presented. Therefore, no unit-based compensation expense has been recognized in these Condensed Consolidated Financial Statements.
For Time-Based Units, the Company recognizes compensation expense over the requisite service period for each separately vesting portion of the profits interest as if the award was, in-substance, multiple awards. The Company determined the fair value of each award on the date of grant using both the income and market approaches, including the “Backsolve” method. The grant date fair value of each Class C Time-Based award corresponds to the most recently completed valuation. As there have not been any Class C Time-Based units awarded after March 31, 2021, the following table summarizes the assumptions and the resulting fair market values (“FMV”) per Class C Time-Based Unit only for purposes of measuring the related compensation expense for those units issued:
| FMV / Unit | ||||||||||||||||
| Valuation | Volatility | RF Rate | Time | at Grant Date | ||||||||||||
| 03.31.2021 | 60.00 | % | 0.06 | % | 0.90 | $4.7410 | ||||||||||
| 12.31.2020 | 65.00 | % | 0.10 | % | 1.10 | $0.4940 | ||||||||||
| 06.11.2020 | 45.00 | % | 0.19 | % | 1.70 | $0.1510 | ||||||||||
| 11.04.2019 | 45.00 | % | 1.60 | % | 2.30 | $0.1280 | ||||||||||
| 12.31.2018 | 40.00 | % | 2.46 | % | 3.10 | $0.1510 | ||||||||||
| 02.08.2018 | 40.00 | % | 2.45 | % | 4.00 | $0.1700 to $0.1900 | ||||||||||
The volatility assumption used in the weighted-average income and market approaches is based on the expected volatility of public companies in similar industries. This has been adjusted to reflect differences between the Company and public companies of similar size, resources, time in industry, and breadth of product and service offerings. The expected dividend yield was assumed to be zero given the Company’s history of declaring dividends and Management’s intentions to not pay dividends in the foreseeable future.
30
P3 HEALTH GROUP HOLDINGS, LLC and SUBSIDIARIES
NOTES TO CONDENSED CONSOLIDATED FINANCIAL STATEMENTS (UNAUDITED)
FOR THE THREE AND NINE MONTHS ENDED SEPTEMBER 30, 2021 and 2020
The following table summarizes and rolls forward the number of Class C Units (Performance-based and Time-based) and their weighted average fair market values based on original grant date:
| Weighted | Performance | Weighted | Total Units | |||||||||||||||||||||
| Time-Based | Vested | Avg. FMV | Based | Avg. FMV | Outstanding | |||||||||||||||||||
| Outstanding, December 31, 2019 | 2,445,833 | 1,058,333 | $ | 0.1280 | 1,625,000 | $ | 0.0417 | 4,070,833 | ||||||||||||||||
| Granted | 600,000 | - | $ | 0.4940 | 950,000 | $ | 0.0363 | 1,550,000 | ||||||||||||||||
| Vested | - | 443,750 | $ | 0.3028 | - | $ | - | - | ||||||||||||||||
| Repurchased | (200,000 | ) | (200,000 | ) | $ | 0.9000 | - | $ | - | (200,000 | ) | |||||||||||||
| Outstanding, December 31, 2020 | 2,845,833 | 1,302,083 | $ | 0.4940 | 2,575,000 | $ | 0.0363 | 5,420,833 | ||||||||||||||||
| Granted | 985,000 | - | $ | 4.7410 | 60,000 | $ | 0.3790 | 1,045,000 | ||||||||||||||||
| Vested | - | 623,750 | $ | 1.0794 | - | $ | - | - | ||||||||||||||||
| Forfeited | (280,000 | ) | - | $ | - | (700,000 | ) | $ | - | (980,000 | ) | |||||||||||||
| Outstanding, September 30, 2021 | 3,550,833 | 1,925,833 | $ | 4.7410 | 1,935,000 | $ | 0.3790 | 5,485,833 | ||||||||||||||||
The Company recognized $999,400 and $271,328 in compensation expense related to the Class C Time-Based Profits Interests for the nine-month periods ended September 30, 2021 and 2020, respectively. These amounts are recognized within operating expenses in P3’s condensed Consolidated Statements of Operations. At September 30, 2021 and December 31, 2020, the Company had $4,364,766 and $1,482,228 in unrecognized compensation expense related to non-vested Class C Time-Based Profits Interests and Subclass B-1 Units that will be realized over a weighted-average period of 2.40 years and 1.69 years, respectively. At September 30, 2021 and December 31, 2020, the Company did not have any unrecognized compensation expense related to Performance-Based Units.
Note 13: Earnings (Loss) per Member Unit
The following table sets forth the computation of basic and diluted earnings (loss) per Member Unit:
| Three Months Ended September 30, | Nine Months Ended September 30, | |||||||||||||||
| 2021 | 2020 | 2021 | 2020 | |||||||||||||
| Net Loss Attributable to Controlling Interests | $ | (31,366,517 | ) | $ | (16,706,718 | ) | $ | (77,700,292 | ) | $ | (27,734,136 | ) | ||||
| Weighted Average Member Units | 68,980,596 | 66,322,878 | 68,159,532 | 65,633,949 | ||||||||||||
| Basic and Diluted Loss per Member Unit | $ | (0.45 | ) | $ | (0.25 | ) | $ | (1.14 | ) | $ | (0.42 | ) | ||||
31
P3 HEALTH GROUP HOLDINGS, LLC and SUBSIDIARIES
NOTES TO CONDENSED CONSOLIDATED FINANCIAL STATEMENTS (UNAUDITED)
FOR THE THREE AND NINE MONTHS ENDED SEPTEMBER 30, 2021 and 2020
Weighted average Member Units includes all outstanding and vested Class A, B-1, C and D Units. The Company has not presented separate Diluted Loss per Member Unit since the results would be anti-dilutive due to the net loss incurred. The following potential Member Units were excluded from Diluted Loss per Member Unit at September 30, 2021 and 2020, respectively:
| 2021 | 2020 | |||||||
| Class B-1 Unvested Units | 2,000,000 | 4,000,000 | ||||||
| Class B-2 Unvested Units | 4,054,054 | 4,054,054 | ||||||
| Class B-3 Unvested Units | 5,647,438 | 5,647,438 | ||||||
| Class C Unvested Units | 3,560,000 | 4,143,750 | ||||||
| Class D Warrants | 858,351 | - | ||||||
| Total Units Excluded from Diluted EPS | 16,119,843 | 17,845,242 | ||||||
Note 14: Premium Deficiency Reserve (“PDR”)
Management assesses the profitability of its at-risk share savings arrangements to identify contracts where current operating results or forecasts indicate probable future losses. If anticipated future variable costs exceed anticipated future revenues, a premium deficiency reserve is recognized. Management concluded the $4,600,000 PDR was required at September 30, 2021.
Note 15: Commitments and Contingencies
Litigation
On or about December 2, 2019, Arizona Medical Services, P.C.’s (“AMS”) sole Member/Manager filed a claim, in the Superior Court of the State of Arizona (County of Pima) against Arizona Connected Care, LLC, now known as P3 Health Partners ACO, LLC (“AzCC”). The claim was for alleged breach of contract, breach of the covenant of good faith and fair dealing, and for accounting. According to the complaint, AzCC allegedly breached its Amended and Restated Operating Agreement, dated January 11, 2012, and amendments thereto by terminating AMS’s membership in AzCC on November 8, 2016 without cause or explanation. AzCC allegedly failed to make distributions to AMS to which it was entitled. On January 17, 2020, AzCC filed an answer to AMS’s complaint denying the allegations therein. The parties have agreed to a settlement of $350,000 (as of April 19, 2021) and satisfaction of previously recorded liabilities of $3.2 million, thus releasing AzCC from any known or further allegations. This settlement was paid on May 3, 2021.
On June 11, 2021, the Company’s Class D Unitholders filed a lawsuit against the Company, and other relevant parties, in the Delaware Court of Chancery alleging a breach of contract related to the Company’s operating agreement. The Class D Unitholders are seeking a judgment to enforce an alleged right to purchase additional units of the Company at a predetermined valuation, as outlined in the Company’s operating agreement. The litigation is pending in the Delaware Court of Chancery. The ultimate resolution and outcome of the matter is unknown and uncertain.
The Company may, from time to time, be subject to various claims and lawsuits arising in the normal course of business. P3 carries general and professional liability insurance coverage to protect the Company’s risk of potential loss in such cases. In the opinion of Management, the ultimate resolution of these matters would not have a material adverse effect on the Company’s financial position or results of operations.
32
P3 HEALTH GROUP HOLDINGS, LLC and SUBSIDIARIES
NOTES TO CONDENSED CONSOLIDATED FINANCIAL STATEMENTS (UNAUDITED)
FOR THE THREE AND NINE MONTHS ENDED SEPTEMBER 30, 2021 and 2020
Commitments
On June 28, 2021, P3, Omni IPA Medical Group, Inc., a California professional corporation (“Omni”), Medcore HP, a California corporation (“MHP”), and certain other parties entered into an Asset and Equity Purchase Agreement and Agreement and Plan of Merger (the “Medcore Purchase Agreement”). Pursuant to the terms of the Medcore Purchase Agreement, P3 will acquire the equity interests of MHP, a licensed health plan under the California Knox-Keene Health Care Service Plan Act, for $31.5 million and the assets of Omni, an independent physician association in San Joaquin County, California, for $5.0 million. The transaction is expected to close following consummation of the Foresight merger and is subject to regulatory approval by the California Department of Managed Health Care and other customary closing conditions.
Uncertainties
The healthcare industry is subject to numerous laws and regulations of Federal, state, and local governments. These laws and regulations include, but are not limited to, matters of licensure, accreditation, government healthcare program participation requirements, reimbursement for patient services, and Medicare / Medicaid Fraud, Waste and Abuse Prevention. Recently, government activity has increased with respect to investigations and allegations concerning possible violations of Fraud, Waste and Abuse statutes and regulations by healthcare providers. Violations of these laws and regulations could result in expulsion from government healthcare programs together with imposition of significant fines and penalties as well as significant repayment for patient services billed.
Management believes the Company is compliant with Fraud, Waste and Abuse regulations as well as other applicable government laws. While no regulatory inquiries have been made, compliance with such laws and regulations is subject to government review and interpretation, as well as other regulatory actions which might be unknown at this time.
Healthcare reform legislation at both the Federal and state levels continues to evolve. Changes continue to impact existing and future laws and rules. Such changes may impact the manner in which P3 conducts business, restrict the Company’s revenue growth in certain eligibility categories, slow down revenue growth rates for certain eligibility categories, increase certain medical, administrative and capital costs, and expose the Company to increased risk of loss or further liabilities. As a result, P3’s consolidated financial position could be impacted by such changes.
COVID-19 Pandemic
On March 11, 2020, the World Health Organization designated COVID-19 a global pandemic. The rapid spread of COVID-19 around the world and throughout the U.S. has altered the behavior of businesses and people, with significant negative effects on Federal, state, and local economies, the duration of which continues to remain unknown. Various mandates were implemented by Federal, state, and local governments in response to the pandemic, which caused many people to remain at home along with forced closure of or limitations on certain businesses. This included suspension of elective procedures by healthcare facilities. While some of these restrictions have been eased across the U.S. and most states have lifted moratoriums on non-emergent procedures, some restrictions remain in place, and many state and local governments are re-imposing certain restrictions due to an increase in reported COVID-19 cases. COVID-19 disproportionately impacts older adults, especially those with chronic illnesses, which describes many of P3’s patients.
33
P3 HEALTH GROUP HOLDINGS, LLC and SUBSIDIARIES
NOTES TO CONDENSED CONSOLIDATED FINANCIAL STATEMENTS (UNAUDITED)
FOR THE THREE AND NINE MONTHS ENDED SEPTEMBER 30, 2021 and 2020
Due to our recurring contracted revenue model, the COVID-19 pandemic did not have a material impact on P3’s revenues during the three months ended and nine months ended of September 30, 2021. Nearly 97% the Company’s total revenues are recurring, consisting of fixed monthly PMPM capitation payments received from MA health plans. Based upon claims paid to date, our direct costs related to COVID-19 claims was approximately $44.0 million for the period from March 1, 2020 through September 30, 2021. We expect to incur additional COVID-19 related costs given the volume of positive cases present in our markets. Management did institute multiple safety measures for P3 employees including a work-from-home policy and access to free vaccinations and personal protective equipment.
The full extent to which COVID-19 will directly or indirectly impact P3, the Company’s future results of operations and financial condition will depend on factors which are highly uncertain and cannot be accurately predicted. This includes new and emerging information from the impact of new variants of the virus, the actions taken to contain it or treat its impact and the economic impact on P3’s markets. Such factors include, but are not limited to, the scope and duration of stay-at-home practices and business closures and restrictions, government-imposed or recommended suspensions of elective procedures, and expenses required for supplies and personal protective equipment. Because of these and other uncertainties, Management cannot estimate the length or severity of the impact of the pandemic on the Company’s business. Furthermore, because of P3’s business model, the full impact of COVID-19 may not be fully reflected in the Company’s results of operations and overall financial condition until future periods. However, Management will continue to closely evaluate and monitor the nature and extent of these potential impacts to P3’s business, results of operations and liquidity.
34
P3 HEALTH GROUP HOLDINGS, LLC and SUBSIDIARIES
NOTES TO CONDENSED CONSOLIDATED FINANCIAL STATEMENTS (UNAUDITED)
FOR THE THREE AND NINE MONTHS ENDED SEPTEMBER 30, 2021 and 2020
Note 16: Related Parties
Intercompany Transactions
BACC entered an agreement (“Services Agreement”) with P3-NV, collectively the “Parties”, under which P3-NV provides BACC with certain management, administrative, and other non-medical support services in connection with BACC’s medical practice. BACC and P3-NV have also entered a separate “Deficit Funding Agreement” whereby P3-NV will provide BACC loans (“Advances”) from time to time principally for the purpose of supporting BACC’s budget in the event BACC’s actual expenses exceed gross revenue. Interest accrues monthly on each Advance from the date of disbursement equal to the prime rate plus 2.0%, as published in the Wall Street Journal, in effect on the date of disbursement. In the event that BACC’s net revenues exceed expenses during the term of this Service and Deficit Funding Agreement, BACC has agreed to pay P3HP-NV 100.0% of such excess within thirty days of the end of any such month, up to the aggregate amount of any unpaid Advances (plus accrued interest). Net Advances made to BACC by P3-NV and accrued interest expense for the nine months ended September 30, 2021 and 2020, were as follows:
| Unaudited | ||||||||
| Nine Months Ended September 30, | ||||||||
| 2021 | 2020 | |||||||
| Balance at Beginning of Year | $ | 17,307,627 | $ | 13,535,053 | ||||
| Advanced During Period | 4,350,621 | 2,440,816 | ||||||
| Interest Accrued During period | 3,197,822 | 864,982 | ||||||
| Balance at End of Period | $ | 24,856,071 | $ | 16,840,852 | ||||
Advances, in most cases, have been constructively made by Holdings on P3-NV’s behalf, and were therefore deemed Advances made by P3-NV. P3-NV’s Advances to BACC include all years prior, for which balances have, historically, not been settled periodically between the Parties and, thus have carried forward one year to the next. However, all transactions related to these Services and Deficit Funding Agreements (including accrued interest) have been eliminated in consolidation.
There were no advances transacted between P3-NV and KWA during the nine months ended September 30, 2021 or 2020.
Atrio Health Plans
Atrio Health Plans was established in 2004 and has since grown to serve Medicare beneficiaries in numerous counties throughout Oregon. Atrio works closely with local providers to improve healthcare outcomes of the populations served. In 2019, Chicago Pacific Founders (“CPF”) made an equity investment in Atrio. CPF is also a Class A Unitholder of the Company. Beginning in 2020, the Company has a Full-Risk capitation agreement in place with Atrio whereby P3 is delegated to perform services on behalf of Atrio’s members assigned to the Company. These delegated services include but are not limited to provider network credentialing, patient authorizations and medical management (care management, quality management and utilization management). In return, the Company earns capitation revenue and management fees and pays claims for Atrio-assigned members, which are summarized in the following table for the periods presented:
| Unaudited | Unaudited | |||||||||||||||
| Three Months Ended September 30, | Nine Months Ended September 30, | |||||||||||||||
| 2021 | 2020 | 2021 | 2020 | |||||||||||||
| Revenue Earned from Capitation | $ | 35,867,712 | $ | 35,281,596 | $ | 112,571,916 | $ | 105,589,970 | ||||||||
| Management Fees | 549,472 | 557,172 | 1,658,944 | 1,675,380 | ||||||||||||
| Claims Paid | 39,949,769 | 35,470,842 | 116,863,741 | 104,231,320 | ||||||||||||
Note 17: Leases
The Company leases real estate in the form of corporate office space and operating facilities. The Company additionally leases certain machinery in the form of office equipment. Generally, the term for real estate leases ranges from one to eight years at inception of the contract. Generally, the term for equipment leases is one to three years at inception of the contract. Some real estate leases include one to two options to renew that can extend the original term by five to ten years.
35
P3 HEALTH GROUP HOLDINGS, LLC and SUBSIDIARIES
NOTES TO CONDENSED CONSOLIDATED FINANCIAL STATEMENTS (UNAUDITED)
FOR THE THREE AND NINE MONTHS ENDED SEPTEMBER 30, 2021 and 2020
Operating lease costs are included within operating expenses on the consolidated statements of operations. The Company does not have any finance leases, short-term lease costs nor any sublease income.
| Nine Months Ended September 30, | ||||||||
| Unaudited | ||||||||
| 2021 | 2020 | |||||||
| Operating Lease Costs | $ | 1,740,067 | $ | 1,218,383 | ||||
| New Assets Obtained in Exchange for Operating Lease Liabilities | 4,104,760 | 847,445 | ||||||
Lease terms and discount rates consisted of the following at each of the periods presented below:
| Unaudited | ||||||||
| September 30, 2021 | December 31, 2020 | |||||||
| Weighted Average Remaining Lease Term (Years)* | 5.09 | 3.74 | ||||||
| Weighted Average Discount Rate | 11.20 | % | 10.30 | % | ||||
| *All Leases are Operating | ||||||||
The table below reconciles the undiscounted future minimum lease payments (displayed by year and in the aggregate) under noncancelable operating leases with terms of more than one year to the total operating and finance lease liabilities recognized on the Company’s Condensed Consolidated Balance Sheets.
| Unaudited | ||||||||
| September 30, 2021 | December 31, 2020 | |||||||
| 2021 | $ | 708,823 | $ | 2,174,095 | ||||
| 2022 | 2,800,484 | 1,963,533 | ||||||
| 2023 | 1,943,823 | 1,191,604 | ||||||
| 2024 | 1,731,167 | 913,732 | ||||||
| 2025 | 1,447,418 | 696,194 | ||||||
| 2026 | 920,928 | 148,330 | ||||||
| Thereafter | 1,927,098 | - | ||||||
| Total Payments for Operating Leases | 11,479,741 | 7,087,488 | ||||||
| Less: Interest | 2,912,300 | 1,251,965 | ||||||
| Present Value of Operating Lease Liabilities | $ | 8,567,441 | $ | 5,835,523 | ||||
The short-term component of operating lease liabilities as of September 30, 2021 and December 31, 2020 was $2,091,518 and $2,174,095, respectively. As these short-term amounts are due within twelve months, they are included in Accounts Payable and Accrued Expenses.
Note 18: Variable Interest Entities
Management accounts for Variable Interest Entity (“VIE”) transactions utilizing an ongoing interest assessment in accordance with ASC 810, Variable Interest Entities and Principles of Consolidation.
36
P3 HEALTH GROUP HOLDINGS, LLC and SUBSIDIARIES
NOTES TO CONDENSED CONSOLIDATED FINANCIAL STATEMENTS (UNAUDITED)
FOR THE THREE AND NINE MONTHS ENDED SEPTEMBER 30, 2021 and 2020
In 2017, Holdings, by way of one of its wholly-owned subsidiaries (P3-NV) entered a collective Stock Transfer Restriction Agreement with the three shareholders of two medical practices, Bacchus Wakefield Kahan, PC (“BACC”) and Kahan Wakefield Abdou, PLLC (“KWA”). The Transfer Restriction Agreement, by way of a Call Option, unequivocally permits P3-NV to select and appoint Successor Physicians to these medical practices if a shareholder vacates their ownership position.
Pursuant to ASC 810, both the “power of control” and “economics” criterion were reviewed for VIE consideration. P3-NV is a single member limited liability company, controlled by Holdings. Holdings’ debt and equity holders collectively represent a “single decision maker” for Holdings and its investment in P3-NV. As to P3-NV’s ability to appoint Successor Physicians to these medical practices, this demonstrates “power of control”. Also, the Deficit Funding Agreement in place between P3-NV and BACC/KWA (see “Related Parties”) states P3-NV will advance BACC/KWA funds, as needed, to support BACC’s/KWA’s working capital needs to the extent operating expenses exceed gross revenue. This funding arrangement further illustrates and fulfills the economic criteria for VIE consolidation.
Management concluded BACC and KWA are VIEs and P3 is the primary beneficiary. Therefore, both practices are consolidated as VIEs. KWA had no financial activity for Management to consider for the periods ended September 30, 2021 nor December 31, 2020. Therefore, the following exhibits include the balance sheets and statement of operations only for BACC:
| Unaudited | ||||||||
| ASSETS | September 30, 2021 | December 31, 2020 | ||||||
| Cash | $ | 113,265 | $ | 183,836 | ||||
| Client Fees and Insurance Receivable, Net | 307,622 | 335,358 | ||||||
| Prepaid Expenses and Other Current Assets | 357,222 | 285,363 | ||||||
| Property, Plant and Equipment, Net | 37,057 | 22,309 | ||||||
| TOTAL ASSETS | $ | 815,167 | $ | 826,866 | ||||
| LIABILITIES AND MEMBERS' DEFICIT | ||||||||
| Accounts Payable and Accrued Expenses | $ | 886,072 | $ | 686,680 | ||||
| Accrued Payroll | 1,304,083 | 1,019,940 | ||||||
| Due to Consolidated Entities of P3 | 24,856,071 | 17,307,627 | ||||||
| TOTAL LIABILITIES | 27,046,226 | 19,014,247 | ||||||
| MEMBERS' DEFICIT | (26,231,059 | ) | (18,187,381 | ) | ||||
| TOTAL LIABILITIES AND MEMBERS' DEFICIT | $ | 815,167 | $ | 826,866 | ||||
| Unaudited | ||||||||||||||||
| Three Months Ended September 30, | Nine Months Ended September 30, | |||||||||||||||
| 2021 | 2020 | 2021 | 2020 | |||||||||||||
| Revenue | $ | 2,239,704 | $ | 2,286,505 | $ | 6,924,861 | $ | 5,235,351 | ||||||||
| Expenses | 5,041,669 | 1,410,945 | 14,968,539 | 8,685,811 | ||||||||||||
| Net Loss | $ | (2,801,965 | ) | $ | 875,560 | $ | (8,043,678 | ) | $ | (3,450,460 | ) | |||||
37
P3 HEALTH GROUP HOLDINGS, LLC and SUBSIDIARIES
NOTES TO CONDENSED CONSOLIDATED FINANCIAL STATEMENTS (UNAUDITED)
FOR THE THREE AND NINE MONTHS ENDED SEPTEMBER 30, 2021 and 2020
Note 19: Subsequent Events
Management has evaluated subsequent events through December 9, 2021, the date on which the condensed consolidated financial statements were available.
On May 25, 2021, Foresight Acquisition Corp. (“Foresight”), and the Company (“P3”) entered an agreement (the “Merger Agreement”) outlining the terms and conditions of a strategic transaction and merger (the “Transaction”). Based on the terms of the Merger Agreement, the combined company has an estimated post-transaction enterprise value in excess of $2.0 billion. Foresight is a blank check company incorporated for the purpose of effecting a business combination with one or more businesses or entities. The transaction closed on December 3, 2021. As a result, P3 merged with and into Foresight, with P3 treated as the acquired entity. As of December 3, 2021, Foresight ceased to be a shell company and a new combined company became listed on the Nasdaq trading under the name “P3 Health Partners, Inc.” (ticker symbol: PIII).
38
MANAGEMENT’S DISCUSSION AND ANALYSIS OF FINANCIAL CONDITION AND RESULTS OF OPERATIONS OF P3
The following discussion should be read in conjunction with the “Selected Historical Financial Information of P3” and the historical audited annual consolidated financial statements as of and for the years ended December 31, 2020, 2019 and 2018 and the unaudited interim condensed consolidated financial statements as of September 30, 2021 and for the nine-month periods ended September 30, 2021 and 2020, and the related respective notes thereto, included or incorporated by reference elsewhere in this Current Report on Form 8-K or included in the Proxy Statement/Prospectus incorporated herein by reference. In addition to historical information, this discussion contains forward-looking statements that involve risks, uncertainties and assumptions that could cause actual results to differ materially from management’s expectations. Factors that could cause such differences are discussed in “Cautionary Note Regarding Forward- Looking Statements” and “Risk Factors” elsewhere in this Form 8-K or included in the Proxy Statement/Prospectus incorporated herein by reference. Unless the context otherwise requires, references in this “Management’s Discussion and Analysis of Financial Condition and Results of Operations of P3” section to “P3”, the “Company”, “we”, “us” and “our” refer to the business and operations of P3 and its consolidated subsidiaries.
Overview
P3 is a patient-centered and physician-led population health management company. We strive to offer superior care to all those in need. We believe that the misaligned incentives in the fee-for-service (“FFS”) healthcare payment model and the fragmentation between physicians and care teams has led to sub-optimal clinical outcomes, limited access, high spending and unnecessary variability in the quality of care. We believe that a platform such as ours, which helps to realign incentives and focuses on treating the full patient, is uniquely positioned to address these healthcare challenges.
We have leveraged the expertise of our management team’s 20+ years of experience in population health management, to build our “P3 Care Model.” The key attributes that differentiate P3 include: 1) patient-focused model, 2) physician-led model, and 3) our fully delegated model. Our model operates by entering into arrangements with payors providing for monthly payments to manage the total healthcare needs of members attributed to our primary care physicians. In tandem, we enter into arrangements directly with existing physician groups or independent physicians in the community to join our value-based care network. In our model, physicians are able to retain their independence and entrepreneurial spirit, while gaining access to the tools, teams and technologies that are key to success in a value-based care model, all while sharing in the savings from successfully improving the quality of patient care and reducing costs.
We operate in the $800 billion Medicare market, which is growing at 7% per year and covers approximately 61 million eligible lives. Our core focus is the Medicare Advantage (“MA”) market, which makes up approximately 40% of the overall Medicare market, or nearly 25 million eligible lives. Medicare beneficiaries may enroll in a MA plan, under which payors contract with the Centers for Medicare & Medicaid Services (“CMS”) to provide a defined range of healthcare services that are comparable to Medicare FFS (which is also referred to as “traditional Medicare”).
We predominantly enter into capitated contracts with the nation’s largest health plans to provide holistic, comprehensive healthcare to MA members. Under the typical capitation arrangement, we are entitled to per member per month fees from payors to provide a defined range of healthcare services for MA health plan members attributed to our primary care physicians (“PCPs”). These per member per month (“PMPM”) fees comprise our capitated revenue and are determined as a percent of the premium (“POP”) payors receive from CMS for these members. Our contracted recurring revenue model offers us highly predictable revenue, and rewards us for providing high-quality care rather than driving a high volume of services. In this capitated arrangement, our goals are well-aligned with payors and patients alike—the more we improve health outcomes, the more profitable we will be over time.
Under this capitated contract structure, we are generally responsible for all members’ medical costs across the care continuum, including, but not limited to emergency room and hospital visits, post-acute care admissions, prescriptions drugs, specialist physician spend and primary care spend. Keeping members healthy is our primary objective. When they need medical care, delivery of the right care in the right setting can greatly impact outcomes. When our members need care outside of our network of PCPs, we utilize a number of tools including network management, utilization management and claims processing to ensure that the appropriate quality care is provided.
39
Our company was formed in 2017, and our first at-risk contract became effective on January 1, 2018. We have demonstrated an ability to rapidly scale, primarily entering markets with our affiliate physician model, and expanding to a PCP network of approximately 1,700 physicians, in 15 markets (counties) across 4 states in under four full years of operations as of September 30, 2021. Our platform has enabled us to grow our annual revenue by 135% from December 31, 2018 to December 31, 2020. As of September 30, 2021, our PCP network served approximately 60,300 MA members. We believe we have significant growth opportunities available to us across existing and new markets, with less than 1% of the 491,060 PCPs in the U.S. currently included in our physician network.
Impact of COVID-19
On March 11, 2020, the World Health Organization designated COVID-19 a global pandemic. The rapid spread of COVID-19 around the world and throughout the U.S. has altered the behavior of businesses and people, with significant negative effects on Federal, state, and local economies, the duration of which continues to remain unknown. Various mandates were implemented by Federal, state, and local governments in response to the pandemic, which caused many people to remain at home, along with forced closure of or limitations on certain businesses. This included suspension of elective procedures by healthcare facilities. While some of these restrictions have been eased across the U.S. and most states have lifted moratoriums on non-emergency procedures, some restrictions remain in place, and many state and local governments are re-imposing certain restrictions due to an increase in reported COVID-19 cases.
COVID-19 disproportionately impacts older adults, especially those with chronic illnesses, which describes many of P3’s patients. To ensure a coordinated response to the pandemic, we created a COVID-19 Task Force that is supported by team members from across the organization. Our company owned clinics remained open to those members with urgent needs, and we successfully pivoted to a telemedicine offering for routine care in order to protect and better serve our patients, providers, care teams and community. We continued to support our affiliate physician network with the tools, team and technology to provide care to the members we serve. Management did institute multiple safety measures for P3 employees including a work-from-home policy and access to free vaccinations and personal protective equipment. Deeply committed to our employees, we made a conscious decision not to furlough any of our employees, even if their function was disrupted by COVID-19. Due to our recurring contracted revenue model, the COVID-19 pandemic did not have a material impact on P3’s revenues during 2020 and the first nine months of 2021. Nearly 97% the Company’s total revenues are recurring, consisting of fixed monthly PMPM capitation payments received from MA health plans. P3 estimates that it incurred approximately $44.0 million of direct costs related to COVID-19 claims during the period from March 1, 2020 through September 30, 2021, including an incremental $5 million related to COVID-19 claims in the three months ended September 30, 2021. We expect to incur additional COVID-19 related costs given the volume of positive cases and “breakthrough” cases (positive cases in vaccinated patients) present in our markets.
Because of the nature of capitation arrangements, the full impact of the COVID-19 pandemic may not be fully reflected in our results of operations and overall financial condition until future periods. The full extent to which COVID-19 will directly or indirectly impact our future results of operations and financial condition will depend on multiple factors. This includes new and emerging information from the impact of new variants of the virus, the actions taken to contain it or treat its impact and the economic impact on our markets. Such factors include, but are not limited to, the scope and duration of stay-at-home practices and business closures and restrictions, government-imposed or recommended suspensions of elective procedures, and expenses required for supplies and personal protective equipment. Because of these factors, management may not be able to fully estimate the length or severity of the impact of the pandemic on our business. Furthermore, because of our business model, the full impact of COVID-19 may not be fully reflected in our results of operations and overall financial condition until future periods. However, management will continue to closely evaluate and monitor the nature and extent of these potential impacts to P3’s business, results of operations and liquidity.
40
Key Factors Affecting our Performance
Growing Medicare Advantage Membership on Our Platform
Membership and revenue are tied to the number of members attributed to our physician network by our payors. We believe we have multiple avenues to serve additional members, including through:
| · | Growth in membership under our existing contracts and existing markets: |
| o | Patients who are attributed to our physician network who (a) age into Medicare and elect to enroll in MA or (b) elect to convert from Medicare FFS to MA |
| · | Adding new contracts (either payor contracts or physician contracts) in existing markets |
| · | Adding new contracts (either payor contracts or physician contracts) in adjacent and new markets |
The strength of our affiliate physician model and its multiple avenues of growth is evident by our growth from 2018 to September 30, 2021.
At September 30, 2021, the number of Medicare Advantage at-risk members on our platform was approximately 60,300 compared to approximately 10,400 members at December 31, 2018, representing a compound annual growth rate (“CAGR”) of 89% over this period. The chart and table below illustrates membership growth from 2018 to 2020:
| December 31, 2018 |
December 31, 2019 | December 31, 2020 |
September 30, 2021 |
CAGR | |||||||||||||||
| At-risk Medicare Advantage Members | 10,400 | 19,700 | 50,600 | 60,300 | 89 | % | |||||||||||||
| Year-over-year % change | 89 | % | 157 | % | |||||||||||||||
41
Growing Existing Contract Membership
According to CMS, the Medicare market is growing at 7% per year and covers approximately 61 million eligible lives as of 2020. Over the last decade, MA penetration has increased from 24% to 40% of the overall Medicare market and makes up nearly 25 million eligible lives today. Recent data suggests that the number of Medicare-eligible patients will continue to increase as the US population ages and becomes eligible for the program. Additionally, recent data from the Kaiser Family Foundation suggests the Medicare Advantage penetration rates will continue to increase in the upcoming years. As these new patients age-in to Medicare and enroll in Medicare Advantage through our payors, they become attributed to our network of physicians with little incremental cost to us.
In addition to age-ins, Medicare eligible patients can change their enrollment selections during select periods throughout the year. Our sales and marketing teams actively work with local community partners to connect with Medicare eligible patients and make them aware of their healthcare choices and the services that P3 offers with our value-based care model, including greater access to their physicians and customized care plans catered to their needs. The ultimate effect of our marketing efforts is increased awareness of P3 and additional patients choosing us as their primary care provider. We believe that our marketing efforts also help to grow our payor partners’ membership base as we grow our own patient base and help educate patients about their choices on Medicare, further aligning our model with that of healthcare payors.
Growing Membership in Adjacent and New Markets
Our affiliate model allows us to quickly and efficiently enter into new and adjacent markets in two ways: 1) partnering with payors and 2) partnering with providers. Because our model honors the existing patient-provider relationship, we are able to deploy our care model around existing physicians in a given a market. By utilizing the local healthcare infrastructure, we can quickly build a network of PCPs to serve the healthcare needs of contracted members.
Our business development and managed care teams maintain an active pipeline of new partnership opportunities for both providers and payors. These potential opportunities are developed through significant inbound interest and the deep relationships our team has developed with their 20+ years of experience in the value-based care space and our proactive assessment of expansion markets. When choosing a market to enter, we make our decision on a county-by-county basis across the United States. We look at various factors including: (i) population size, (ii) payor participants and concentration, (iii) health system participants and concentration, and (iv) competitive landscape.
When entering a new market, we supplement the existing physician network with local market leadership teams and support infrastructure to drive the improvement in medical cost and quality. When entering an adjacent market, we’re able to leverage the investments we previously made to have a faster impact on our expanded footprint. We have historically demonstrated success in effectively growing into new and adjacent markets. As of September 30, 2021, we operate in 15 markets, markets being counties, across four states. P3 is actively pursuing opportunities to expand operations to additional states in the Southwest and Midwest. One of the key uses of the proceeds from the consummation of the previously announced business combinations (the “Business Combinations”) and private placement subscription agreements (“PIPE”) financing on December 3, 2021, after accounting for distributions to existing shareholders, is to fund the investment required to enter these new markets and to take on additional new contracts.
Growing Membership in Existing Markets
Once established in a market, we have an opportunity to efficiently expand both our provider and payor contracts. Given the benefits PCPs experience from joining our P3 Care Model, which offers providers the teams, tools and technologies to better support their patient base, we often experience growth in our affiliate network after entering a market. Because of the benefits, we have also historically experienced high retention with our affiliate providers. From 2018 through September 30, 2021, P3 experienced a 99% physician retention rate in our affiliate provider network. By expanding our affiliate provider network and adding new physicians to the P3 network, we can quickly increase the number of contracted at-risk members under our existing health plan arrangements.
Additionally, by expanding the number of contracted payors, we can leverage our existing infrastructure to quickly increase our share of patients within our physician network. We have a proven ability to manage medical costs and improve clinical outcomes of our lives under management on behalf of our payor partners. This is evidenced by the receipt of inbound partnership requests from payors to improve growth, quality and profitability in their markets.
42
Growing Capitated Revenue Per Member
Medicare pays capitation using a risk adjusted model, which compensates payors based on the health status, or acuity, of each individual member. Payors with higher acuity members receive a higher payment and those with lower acuity members receive a lower payment. Moreover, some of our capitated revenues also include adjustments for performance incentives or penalties based on the achievement of certain clinical quality metrics as contracted with payors. Given the prevalence of fee-for-service arrangements, our patients often have historically not participated in a value-based care model, and therefore their health conditions are poorly documented. Through the P3 Care Model, we determine and assess the health needs of our patients and create an individualized care plan consistent with those needs. We capture and document health conditions as a part of this process. We expect that our PMPM revenue will continue to improve the longer members participate in our care model as we better understand and assess their health status (acuity) and coordinate their medical care.
Effectively Managing Member Medical Expense
Our medical claims expense is our largest expense category, representing 88% of our total operating expenses for the three and nine months ended September 30, 2021. We manage our medical costs by improving our members access to healthcare. Our care model focuses on maintaining health and leveraging the primary care setting as a means of avoiding costly downstream healthcare costs, such as emergency department visits and acute hospital inpatient admissions. The power of our model is reflected in the relative performance of our network when compared to local FFS benchmarks. For example, in 2019 our Arizona members’ ED utilization was 36% lower than the local FFS benchmark and inpatient hospital admission rate was 35% lower than the local FFS benchmark.
43
Achieving Operating Efficiencies
As a result of our affiliate model and ability to leverage our existing local and national infrastructure, we generate operating efficiencies at both the market and enterprise level. Our local corporate, general and administrative expense, which includes our local leadership, care management teams and other operating costs to support our markets, are expected to decrease over time as a percentage of revenue as we add members to our existing contracts, grow membership with new payor and physician contracts, and our revenue subsequently increases. Our corporate general and administrative expenses at the enterprise level include resources and technology to support payor contracting, quality, data management, delegated services, finance and legal functions. While we expect our absolute investment in our enterprise resources to increase over time, we expect it will decrease as a percentage of revenue when we are able to leverage our infrastructure across a broader group of at-risk members. We expect our corporate, general and administrative expenses to increase in absolute dollars in the future as we continue to invest to support growth of our business, as well as due to the costs required to operate as a public company, including insurance coverage, investments in internal audit, investor relations and financial reporting functions, fees paid to the exchange on which we list our securities, and increased legal and audit fees.
Impact of Seasonality
Our operational and financial results will experience some variability depending upon the time of year in which they are measured. This variability is most notable in the following areas:
At-Risk Member Growth. While new members are attributed to our platform throughout the year, we experience the largest portion of our at-risk member growth during the first quarter. Contracts with new payors typically begin on January 1, at which time new members become attributed to our network of physicians. Additionally, new members are attributed to our network on January 1, when plan enrollment selections made during the prior Annual Enrollment Period from October 15th through December 7th of the prior year take effect.
Revenue Per Member. Our revenue is based on percentage of premium we have negotiated with our payors as well as our ability to accurately and appropriately document the acuity of a member’s health status. We experience some seasonality with respect to our per member revenue as it will generally decline over the course of the year. In January of each year, CMS revises the risk adjustment factor for each patient based upon health conditions documented in the prior year, leading to an overall increase in per-patient revenue. As the year progresses, our per-patient revenue declines as new patients join us typically with less complete or accurate documentation (and therefore lower risk-adjustment scores) and patients with more severe acuity profiles (and, therefore, higher per member revenue rates) expire.
Medical Costs. Medical expense is driven by utilization of healthcare services by our attributed membership. Medical expense will vary seasonally depending on a number of factors, including the weather and the number of business days. Certain illnesses, such as the influenza virus, are far more prevalent during colder months of the year, which will result in an increase in medical expenses during these time periods. We would therefore expect to see higher levels of per-member medical expense in the first and fourth quarters. Business days can also create year-over-year comparability issues if one year has a different number of business days compared to another.
Key Performance Metrics
In addition to our GAAP and non-GAAP financial information, we monitor the following operating metrics to help us evaluate our business, identify trends affecting our business, formulate business plans and make strategic decisions. We believe the following key metrics are useful in evaluating our business:
| September 30, 2020 | September 30, 2021 | |||||||
| At-risk members | 49,300 | 60,300 | ||||||
| Affiliate PCPs | 1,500 | 1,700 | ||||||
44
At-Risk Membership
At-risk membership represents the approximate number of Medicare Advantage members for whom we receive a fixed per member per month fee under capitation arrangements as of the end of a particular period.
Contracted Primary Care Physicians
Contracted primary care physicians represent the approximate number of primary care physicians included in our affiliate network, with whom members may be attributed under our capitation arrangements, as of the end of a particular period.
The key metric we utilize to measure our profitability and performance is Adjusted EBITDA.
Key Components of Results of Operations
Revenue
Capitated revenue. We contract with health plans using an at-risk model. Under the at-risk model, we are responsible for the cost of all covered health care services provided to members assigned by the health plans to the Company in exchange for a fixed payment, which generally is a POP based on health plans’ premiums received from CMS. Through this capitation arrangement, we stand ready to provide assigned MA members all their medical care via our directly employed and affiliated physician/specialist network.
The premiums health plans receive are determined via a competitive bidding process with CMS and are based on the costs of care in local markets and the average utilization of services by patients enrolled. Medicare pays capitation using a “risk adjustment model”, which compensates providers based on the health status (acuity) of each individual patient. MA plans with higher acuity patients receive higher premiums. Conversely, MA plans with lower acuity patients receive lesser premiums. Under the risk adjustment model, capitation is paid on an interim basis based on enrollee data submitted for the preceding year and is adjusted in subsequent periods after final data is compiled. As premiums are adjusted via this risk adjustment model (via a Risk Adjustment Factor, “RAF”), our PMPM payments will change commensurately with how our contracted MA plans’ premiums change with CMS.
Management determined the transaction price for these contracts is variable as it primarily includes PMPM fees, which can fluctuate throughout the course of the year based on the acuity of each individual enrollee. In certain contracts, PMPM fees also include adjustments for items such as performance incentives or penalties based on the achievement of certain clinical quality metrics as contracted with payors. Capitated revenues are recognized based on an estimated PMPM transaction price to transfer the service for a distinct increment of the series (e.g. month) and is recognized net of projected acuity adjustments and performance incentives or penalties as management can reasonably estimate the ultimate PMPM payment of those contracts. We recognize revenue in the month in which attributed members are entitled to receive healthcare benefits during the contract term. The capitation amount is subject to possible retroactive premium risk adjustments based on the member’s individual acuity.
See “—Critical Accounting Policies and Estimates—Capitated Revenue” for more information.
Other patient service revenue. Other patient service revenue is comprised primarily of encounter-related fees to treat patients outside of P3’s at-risk arrangements at company owned clinics. Other patient service revenue also includes ancillary fees earned under contracts with certain payors for the provision of certain care coordination and other care management services. These services are provided to patients covered by these payors regardless of whether those patients receive their care from our directly employed or affiliated medical groups.
45
Operating expenses
Medical expense. Medical expense primarily includes costs of all covered services provided to members by non-P3 employed providers. This also includes an estimate of the cost of services that have been incurred, but not yet reported (“IBNR”). IBNR is recorded as “Claims Payable” in the accompanying consolidated balance sheets. Estimates for incurred claims are based on historical enrollment and cost trends while also taking into consideration operational changes. Future and actual results typically differ from estimates. Differences could result from an overall change in medical expenses per member, changes in member mix or simply due to the addition of new members. IBNR estimates are made on an accrual basis and adjusted in future periods as required. To the extent we revise our estimates of incurred but not reported claims for prior periods up or down, there would be a correspondingly favorable or unfavorable effect on our current period results that may or may not reflect changes in long term trends in our performance.
Corporate, general and administrative expense. Corporate, general and administrative expenses include employee-related expenses, including salaries and related costs and stock-based compensation for our executive, technology infrastructure, operations, clinical and quality support, finance, legal, and human resources departments. In addition, general and administrative expenses include all corporate technology and occupancy costs.
Sales and marketing expense. Sales and marketing expenses consist of costs related to patient and provider marketing and community outreach. These expenses capture all costs for both our local and enterprise sales and marketing efforts.
Depreciation expense. Depreciation expense is associated with our property and equipment. Depreciation includes expenses associated with leasehold improvements, computer equipment and software, furniture and fixtures and internally developed software.
Premium deficiency reserve. Premium deficiency reserves (“PDR”) are recognized when there is a future probable loss on unearned capitated premiums after deducting estimated and expected claim costs and claim adjustment expenses and maintenance expenses. PDR represents the advance recognition of a probable future loss in the current period’s financial statements. If a PDR exists, the amount is recognized by recording an additional liability for the probable future deficiency on the current period’s consolidated balance sheet with a corresponding non-cash charge to the consolidated statement of operations.
Other income/(expense)
Other income/(expense), net includes the following items:
| • | Interest expense, which consists primarily of preferred returns associated with our Class A and Class D units, interest expense associated with our outstanding debt, and amortization of discount and costs from issuance of debt. |
| • | Other expense, which consists primarily of mark-to-market adjustments associated with Class D warrants issued in connection to P3’s Term Loan and Security Agreement and tax-related expenses. |
Results of Operations
The following table sets forth our consolidated statements of operations data for the periods indicated:
Comparison of the Three Months and Nine Months Ended September 30, 2020 and 2021
Three Months Ended September 30, (unaudited) | Nine Months Ended September 30, (unaudited) | |||||||||||||||
| ($s in thousands) | 2020 | 2021 | 2020 | 2021 | ||||||||||||
| Revenue: | ||||||||||||||||
| Capitated revenue | $ | 124,461 | $ | 152,277 | $ | 351,018 | $ | 447,137 | ||||||||
| Other patient service revenue | 4,380 | 4,243 | 9,646 | 12,366 | ||||||||||||
| Total revenues | $ | 128,841 | $ | 156,520 | $ | 360,664 | $ | 459,503 | ||||||||
| Operating expenses: | ||||||||||||||||
| Medical expense | 127,016 | 161,663 | 348,258 | 459,233 | ||||||||||||
| Premium deficiency reserve | 1,073 | 1,600 | (1,305 | ) | 4,600 | |||||||||||
| Corporate, general & administrative expenses | 13,743 | 20,434 | 36,774 | 53,883 | ||||||||||||
| Sales & marketing expense | 279 | 491 | 631 | 1,118 | ||||||||||||
| Depreciation expense | 245 | 456 | 613 | 1,219 | ||||||||||||
| Total operating expense | 142,356 | 184,644 | 384,971 | 520,053 | ||||||||||||
| Loss from operations | $ | (13,515 | ) | $ | (28,124 | ) | $ | (24,307 | ) | $ | (60,550 | ) | ||||
| Other expense: | ||||||||||||||||
| Interest income (expense), net | (2,316 | ) | (4,643 | ) | (6,878 | ) | (13,131 | ) | ||||||||
| Other | - | (1,402 | ) | - | (12,063 | ) | ||||||||||
| Total other expense | (2,316 | ) | (6,045 | ) | (6,878 | ) | (25,194 | ) | ||||||||
| Net income (loss) | $ | (15,831 | ) | $ | (34,169 | ) | $ | (31,185 | ) | $ | (85,744 | ) | ||||
| Net income (loss) attributable to non-controlling interests | 876 | (2,802 | ) | (3,450 | ) | (8,044 | ) | |||||||||
| Net income (loss) attributable to controlling interests | $ | (16,707 | ) | $ | (31,367 | ) | $ | (27,735 | ) | $ | (77,770 | ) | ||||
46
The following table sets forth our consolidated statements of operations data expressed as a percentage of total revenues for the periods presented:
| Three months ended September 30, | Nine months ended September 30, | |||||||||||||||
| (unaudited) | 2020 | 2021 | 2020 | 2021 | ||||||||||||
| Revenue: | ||||||||||||||||
| Capitated revenue | 97 | % | 97 | % | 97 | % | 97 | % | ||||||||
| Other patient service revenue | 3 | % | 3 | % | 3 | % | 3 | % | ||||||||
| Total revenues | 100 | % | 100 | % | 100 | % | 100 | % | ||||||||
| Operating expenses: | ||||||||||||||||
| Medical expense | 99 | % | 103 | % | 97 | % | 100 | % | ||||||||
| Premium deficiency reserve | 1 | % | 1 | % | 0 | % | 1 | % | ||||||||
| Corporate, general & administrative expenses | 11 | % | 13 | % | 10 | % | 12 | % | ||||||||
| Sales & marketing expense | 0 | % | 0 | % | 0 | % | 0 | % | ||||||||
| Depreciation expense | 0 | % | 0 | % | 0 | % | 0 | % | ||||||||
| Total operating expense | 110 | % | 118 | % | 107 | % | 113 | % | ||||||||
| Loss from operations | -10 | % | -18 | % | -7 | % | -13 | % | ||||||||
| Other expense: | ||||||||||||||||
| Interest income (expense), net | -2 | % | -3 | % | -2 | % | -3 | % | ||||||||
| Other | 0 | % | -1 | % | 0 | % | -3 | % | ||||||||
| Total other expense | -2 | % | -4 | % | -2 | % | -5 | % | ||||||||
| Net income (loss) | -12 | % | -22 | % | -9 | % | -19 | % | ||||||||
| Net income (loss) attributable to non-controlling interests | 1 | % | -2 | % | -1 | % | -2 | % | ||||||||
| Net income (loss) attributable to controlling interests | -13 | % | -20 | % | -8 | % | -17 | % | ||||||||
Revenue
| Three Months Ended September 30, | Nine Months Ended September 30, | |||||||||||||||||||||||||||||||
| ($s in thousands-unaudited) |
2020 |
2021 | $ Change | % Change | 2020 | 2021 | $ | % Change | ||||||||||||||||||||||||
| Revenue: | ||||||||||||||||||||||||||||||||
| Capitated revenue | $ | 124,461 | $ | 152,277 | $ | 27,816 | 22 | % | $ | 351,018 | $ | 447,137 | $ | 96,119 | 27 | % | ||||||||||||||||
| Other patient service revenue | 4,380 | 4,243 | (137 | ) | -3 | % | 9,646 | 12,366 | 2,720 | 28 | % | |||||||||||||||||||||
| Total revenues | $ | 128,841 | $ | 156,520 | $ | 27,679 | 21 | % | $ | 360,664 | $ | 459,503 | $ | 98,839 | 27 | % | ||||||||||||||||
Capitated revenue was $152.3 million for the three months ended September 30, 2021. This represented an increase of $27.8 million (or 22%) compared to $124.5 million for the three months ended September 30, 2020. This increase was driven primarily by a 22% increase in the total number of at-risk members from approximately 49,300 at September 30, 2020 to approximately 60,300 at September 30, 2021. Capitation revenue rates remained relatively the same from September 30, 2020 to September 30, 2021. Capitated revenue was approximately 97% of total revenue for the three months ended September 30, 2021.
Capitated revenue was $447.1 million for the nine months ended September 30, 2021. This represented an increase of $96.1 million (or 27%) compared to $351.0 million for the nine months ended September 30, 2020. This increase was driven primarily by a 22% increase in the total number of at-risk members from approximately 49,300 at September 30, 2020 to approximately 60,300 at September 30, 2021 and a 6% increase in capitation revenue rates, due to increased premiums from patients with a higher average level of acuity. Capitated revenue was approximately 97% of total revenue for the nine months ended September 30, 2021.
47
Other patient service revenue was $4.2 million for the three months ended September 30, 2021, relatively consistent with that of $4.3 million for the three months ended September 30, 2020. FFS encounters at company-owned clinics and care coordination service fees remained relatively flat year-over-year. Other patient service revenue was approximately 3% of total revenue for the three months ended September 30, 2021 and 2020.
Other patient service revenue was $12.4 million for the nine months ended September 30, 2021, an increase of $2.7 million (or 28%) compared to $9.6 million for the nine months ended September 30, 2020. This increase was primarily driven by increased FFS encounters at company owned clinics and increased fees associated with care coordination services. Other patient service revenue was approximately 3% of total revenue for the nine months ended September 30, 2021 and 2020.
Operating expenses
| Three Months Ended September 30 | Nine Months Ended September 30, | |||||||||||||||||||||||||||||||
($s in thousands-unaudited) | 2020 | 2021 | $ Change | % Change | 2020 | 2021 | $ Change | % Change | ||||||||||||||||||||||||
| Operating expenses: | ||||||||||||||||||||||||||||||||
| Medical expense | $ | 127,016 | $ | 161,663 | $ | 34,647 | 27 | % | $ | 348,258 | $ | 459,233 | $ | 110,975 | 32 | % | ||||||||||||||||
| Premium deficiency reserve | 1,073 | 1,600 | 527 | 49 | % | (1,305 | ) | 4,600 | 5,905 | NM | ||||||||||||||||||||||
| Corporate, general & administrative expenses | 13,743 | 20,434 | 6,691 | 49 | % | 36,774 | 53,883 | 17,109 | 47 | % | ||||||||||||||||||||||
| Sales & marketing expense | 279 | 491 | 212 | 76 | % | 631 | 1,118 | 487 | 77 | % | ||||||||||||||||||||||
| Depreciation expense | 245 | 456 | 211 | 86 | % | 613 | 1,219 | 606 | 99 | % | ||||||||||||||||||||||
| Total operating expenses | $ | 142,356 | $ | 184,644 | $ | 42,288 | 30 | % | $ | 384,971 | $ | 520,053 | $ | 135,082 | 35 | % | ||||||||||||||||
Medical expense was $161.6 million for the three months ended September 30, 2021, an increase of $34.6 million (or 27%) compared to $127.0 million for the three months ended September 30, 2020. These increases were largely driven by a 22% increase in the total number of at-risk members year-over-year, and a 2% increase in the cost per patient.
Medical expense was $459.2 million for the nine months ended September 30, 2021, an increase of $111.9 million (or 32%), compared to $348.3 million for the nine months ended September 30, 2020. These increases were largely driven by an 22% increase in the total number of at-risk members year-over-year, and an 9% increase in the cost per patient. Medical expense increases outpaced our revenue growth in 2021 primarily due to higher utilization and medical costs during the nine months ended September 30, 2021, compared to the nine months ended September 30, 2020, as patients avoided care in 2020 due to COVID-19 stay-at-home orders.
Corporate, general and administrative expense was $20.4 million for the three months ended September 30, 2021, an increase of $6.7 million (or 49%) compared to $13.7 million for the three months ended September 30, 2020. The increase was primarily driven by higher salaries and benefits expense of $4.5 million, as headcount increased 48% from September 30, 2020 to September 30, 2021. The remaining $2.2 million of this increase was primarily driven by transaction expenses related to P3’s merger with Foresight.
Corporate, general and administrative expense was $53.9 million for the nine months ended September 30, 2021, an increase of $17.1 million (or 47%), compared to $36.8 million for the nine months ended September 30, 2020. The increase was primarily driven by higher salaries and benefits expense of $11.8 million, as headcount increased 48% from September 30, 2020 to September 30, 2021. The remaining $5.3 million of this increase was driven by a combination of $0.9 million in Transaction expenses related to P3’s merger with Foresight and $4.4 million of infrastructure costs related to the Company’s headcount growth and continued expansion.
48
Sales and marketing expense was $0.5 million for the three months ended September 30, 2021, an increase of $0.2 million (or 76%) compared to $0.3 million for the three months ended September 30, 2020. The increase was driven by higher spending related to patient and provider marketing initiatives.
Sales and marketing expense was $1.1 million for the nine months ended September 30, 2021, an increase of $0.5 million (or 77%), compared to $0.6 million for the nine months ended September 30, 2020. The increase was driven by higher spending related to patient and provider marketing initiatives.
Depreciation expense was $0.5 million for the three months ended September 30, 2021, an increase of $0.2 million (or 86%) compared to $0.3 million for the three months ended September 30, 2020. The increase was driven by higher amortization of internally developed software and an increase in property, plant and equipment primarily associated with opening new administrative offices and clinics.
Depreciation expense was $1.2 million for the nine months ended September 30, 2021, an increase of $0.6 million (or 99%) compared to $0.6 million for the nine months ended September 30, 2020. The increase was driven by increased amortization of internally developed software and an increase in property, plant and equipment primarily associated with opening new administrative offices and clinics.
Premium deficiency reserve was $1.6 million for the three months ended September 30, 2021, an increase of $0.5 million (or 49%) compared to $1.1 million for the three months ended September 30, 2020. Premium deficiency reserve was $4.6 million for the nine months ended September 30, 2021, an increase of $5.9 million compared to ($1.3) million for the nine months ended September 30, 2020. These fluctuations in operating results are primarily driven by the absorption and recognition of premium deficiencies occurring throughout the year. Projected losses are recognized in advance of their actual economic occurrence. Conversely, these deficiencies are absorbed (e.g. reversed) upon their actual economic occurrence. These deficiencies were recognized during the three months ended September 30, 2021 and the nine months ended September 30, 2021 due to the combined impact of membership growth, business seasonality and COVID-19 hospital admissions.
Other income/(expense)
Interest expense was $4.6 million for the three months ended September 30, 2021, an increase of $2.3 million (or 100%) compared to $2.3 million for the three months ended September 30, 2020. The increase was primarily driven by interest on drawdowns from our available debt Facility of $52.8 million, which occurred subsequent to September 30, 2020.
Interest expense was $13.1 million for the nine months ended September 30, 2021, an increase of $6.2 million (or 91%) compared to $6.9 million for the nine months ended September 30, 2020. The increase was primarily driven by interest on drawdowns from our debt Facility of $52.8 million, which occurred subsequent to September 30, 2020.
Other expense was $1.4 million and $12.1 million for the three months and nine months ended September 30, 2021. This expense was primarily related to a mark-to-market adjustments to record the fair market value of warrants issued in connection with P3’s Term Loan and Security Agreement, which occurred during the quarter ended December 31, 2020.
49
Supplemental Unaudited Presentation of Consolidated Adjusted Earnings Before Interest, Taxes, Depreciation and Amortization (“Adjusted EBITDA”) for the Three and Nine Months Ended September 30, 2021 and 2020
Adjusted EBITDA is a non-GAAP financial measure. We present Adjusted EBITDA because we believe it helps investors understand underlying trends in our business and facilitates an understanding of our operating performance from period to period because it facilitates a comparison of our recurring core business operating results. Adjusted EBITDA is intended as a supplemental measure of our performance that is neither required by, nor presented in accordance with, GAAP. Our presentation of these measures should not be construed as an inference that our future results will be unaffected by unusual or non-recurring items. Our computation of Adjusted EBITDA may not be comparable to other similarly titled measures computed by other companies, because all companies may not calculate Adjusted EBITDA in the same fashion. The definition of Adjusted EBITDA may not be the same as the definitions used in any of our debt agreements.
By definition, EBITDA consists of net income (loss) before interest, income taxes, depreciation and amortization. We define Adjusted EBITDA as EBITDA adjusted to add back the effect of transaction costs for the Business Combinations and certain non-cash expenses, such as mark-to-market warrant expense, premium deficiency reserves and stock-based compensation expense.
Adjusted EBITDA is not a measure of performance or liquidity calculated in accordance with GAAP. It is unaudited and should not be considered an alternative to, or more meaningful than, net income (loss) as an indicator of our operating performance. Uses of cash flows that are not reflected in Adjusted EBITDA include capital expenditures, interest payments, debt principal repayments, and other expenses defined above, which can be significant. As a result, Adjusted EBITDA should not be considered as a measure of our liquidity.
Because of these limitations, Adjusted EBITDA should not be considered in isolation or as a substitute for performance measures calculated in accordance with GAAP. We compensate for these limitations by relying primarily on our GAAP results and using Adjusted EBITDA on a supplemental basis. You should review the reconciliation of net loss to Adjusted EBITDA set forth above and not rely on any single financial measure to evaluate our business.
The following table sets forth a reconciliation of net income (loss) to Adjusted EBITDA using data derived from our unaudited consolidated financial statements for the periods indicated (dollars in thousands):
Three Months Ended September 30, (unaudited) | Nine Months Ended September 30, (unaudited) | |||||||||||||||
| ($s in thousands) | 2020 | 2021 | 2020 | 2021 | ||||||||||||
| Net income (loss) | $ | (15,831 | ) | $ | (34,169 | ) | $ | (31,185 | ) | $ | (85,744 | ) | ||||
| Interest (income) expense, net | 2,316 | 4,643 | 6,878 | 13,131 | ||||||||||||
| Income tax expense | — | — | — | — | ||||||||||||
| Depreciation expense | 245 | 456 | 613 | 1,219 | ||||||||||||
| Mark-to-market warrant expense | — | 1,402 | — | 12,063 | ||||||||||||
| Premium deficiency reserve | 1,073 | 1,600 | (1,305 | ) | 4,600 | |||||||||||
| Transaction expense, Business Combinations | — | 919 | — | 919 | ||||||||||||
| Stock-based compensation | 53 | 355 | 651 | 1,379 | ||||||||||||
| EBITDA, adjusted | $ | (12,144 | ) | $ | (24,794 | ) | $ | (24,348 | ) | $ | (52,433 | ) | ||||
50
Liquidity and Capital Resources
General
To date, we have financed our operations principally through private placements of our equity securities, payments from our payors and borrowings under the Facility. We generate cash primarily from our contracts with payors. As of September 30, 2021, we had cash and restricted cash of $4.7 million.
We expect to continue to incur operating losses and generate negative cash flows from operations for the foreseeable future due to the investments we intend to make in expanding our business and additional general and administrative costs we expect to incur to operate as a public company. As a result, we may require additional capital resources to execute strategic initiatives to grow our business.
Our primary uses of cash include payments for medical expenses, administrative expenses, cost associated with our care model, debt service and capital expenditures. Final reconciliation and receipts of amounts due from payors are typically settled in arrears.
Following the completion of the Business Combinations (the “Closing”) on December 3, 2021, substantially all of P3 Health Partners Inc.’s assets and operations are held and conducted by P3 Health Group, LLC (“P3 LLC”) the surviving company post-combination. The ability of P3 Health Partners Inc. to pay taxes, make payments under the Tax Receivable Agreement and to pay dividends will depend on the financial results and cash flows of P3 LLC and the distributions received from P3 LLC. Deterioration in the financial condition, earnings or cash flow of P3 LLC for any reason could limit or impair P3 LLC ability to pay such distributions. Additionally, to the extent that P3 Health Partners Inc. needs funds and P3 LLC is restricted from making such distributions under applicable law or regulation or under the terms of any financing arrangements, or P3 LLC is otherwise unable to provide such funds, it could materially adversely affect the liquidity and financial condition of P3 Health Partners Inc.. It is anticipated that the distributions P3 Health Partners Inc. will receive from P3 LLC may, in certain periods, exceed the actual tax liabilities and obligations to make payments under the Tax Receivable Agreement.
Under the terms of the Tax Receivable Agreement, P3 Health Partners Inc. generally will be required to pay to the P3 Equityholders, and to each other person from time to time that becomes a “TRA Party” under the Tax Receivable Agreement, 85% of the tax savings, if any, that we are deemed to realize in certain circumstances as a result of certain tax attributes that exist following the Business Combinations and that are created thereafter, including as a result of payments made under the Tax Receivable Agreement. We will retain the benefit of 15% of these cash savings. The term of the Tax Receivable Agreement will continue until all such tax benefits have been utilized or expired unless we exercise our right to terminate the Tax Receivable Agreement for an amount representing the present value of anticipated future tax benefits under the Tax Receivable Agreement (calculated based on certain assumptions, including regarding tax rates and utilization of basis adjustments) or certain other acceleration events occur. Any payments made under the Tax Receivable Agreement will generally reduce the amount of overall cash flow that might have otherwise been available to us and, to the extent that we are unable to make payments under the Tax Receivable Agreement for any reason, the unpaid amounts generally will be deferred and will accrue interest until paid by us.
We believe that as a result of the Closing of the Business Combinations, our cash, cash equivalents and restricted cash will be sufficient to fund our operating and capital needs for at least the next 12 months. Our assessment of the period of time through which our financial resources will be adequate to support our operations is a forward-looking statement and involves risks and uncertainties. Our actual results could vary because of, and our future capital requirements will depend on, many factors, including our growth rate, medical expenses, and the timing and extent of our expansion into new markets. We may in the future enter into arrangements to acquire or invest in complementary businesses, services and technologies, including intellectual property rights. We have based this estimate on assumptions that may prove to be wrong, and we could use our available capital resources sooner than we currently expect. In the event that additional financing is required from outside sources, we may need to finance our operations through a combination of public or private equity or debt financings or other capital sources. However, there can be no assurance that any additional financing or strategic transactions will be available to the Company on acceptable terms, if at all. If events or circumstances occur such that the Company does not obtain additional funding, this could have a material adverse effect on the Company’s business, results of operations or financial condition.
51
Cash Flows
The following summary discussion of our cash flows is based on the consolidated statements of cash flows. The following table sets forth changes in cash flows (dollars in thousands):
| Nine Months Ended September 30, | ||||||||
| ($s in thousands-unaudited) | 2020 | 2021 | ||||||
| Net cash used in operating activities | $ | (6,645 | ) | $ | (39,827 | ) | ||
| Net cash used in investing activities | $ | (1,897 | ) | $ | (7,884 | ) | ||
| Net cash provided by (used in) financing activities | $ | (22 | ) | $ | 12,491 | |||
| Net change in cash | $ | (8,564 | ) | $ | (35,220 | ) | ||
| Cash at beginning of year/period | $ | 32,905 | $ | 39,903 | ||||
| Cash at end of year/period | $ | 24,341 | $ | 4,683 | ||||
Operating Activities
Net cash used in operating activities was $39.8 million for the nine months ended September 30, 2021, an increase in net cash used of $33.2 million compared to net cash used in operating activities of $6.6 million for the nine months ended September 30, 2020. Significant changes impacting net cash used in operating activities during the nine months ended September 30, 2021 as compared to the nine months ended September 30, 2020 were as follows:
• an increase in our adjusted net loss for the nine months ended September 30, 2021 of $32.8 million (net loss of $85.7 million, which includes non-cash items such as depreciation, amortization, mark-to-market adjustments for warrants and premium deficiency reserves totaling $27.2 million) compared to an adjusted net loss for the nine months ended September 30, 2020 of $25.7 million (net loss of $31.2, which includes non-cash items totaling $5.5 million);
• an increase in our net health plan receivables for the nine months ended September 30, 2021 of $7.9 million compared to an increase in our net health plan receivables for the nine months ended September 30, 2020 of $21.0 million;
• offset by an increase in our accounts payable, accrued payroll and accrued interest for the nine months ended September 30, 2021 of $5.7 million compared to an increase for the nine months ended September 30, 2020 of $8.7 million; and
• offset by an increase in our claims payable for the nine months ended September 30, 2021 of $18.2 million compared to an increase in our claims payable for the nine months ended September 30, 2020 of $32.3 million.
Investing Activities
Net cash used in investing activities was $7.9 million for the nine months ended September 30, 2021 compared to $1.9 million for the nine months ended September 30, 2020, as capital investments in property, plant and equipment increased by $0.8 million year-over-year and 3 medical practices were acquired in 2021 for a total purchase price of $5.1 million.
Financing Activities
Net cash provided by financing activities was $12.5 million for the nine months ended September 30, 2021 compared to net cash used in financing activities of $0.1 million for the nine months ended September 30, 2020. The $12.5 million increase primarily related to proceeds drawn down from long-term debt during the nine months ended September 30, 2021.
Contractual Obligations and Commitments
Our principal commitments consist of repayments of unpaid claims, long-term debt on term loans, unsecured debt and operating leases for our facilities.
52
The following table summarizes our contractual obligations as of September 30, 2021:
| Payments due by Period | ||||||||||||||||||||
Total | Less than 1 year | 1-3 years | 3-5 years | More than 5 years | ||||||||||||||||
| Unpaid claims | $ | 75,108 | $ | 75,108 | ||||||||||||||||
| Term loan | $ | 52,750 | - | - | $ | 52,750 | - | |||||||||||||
| Unsecured debt | $ | 15,000 | - | $ | 15,000 | - | - | |||||||||||||
| Operating lease obligations | $ | 8,568 | $ | 2,097 | $ | 2,942 | $ | 1,919 | $ | 1,610 | ||||||||||
| Other | $ | 69 | $ | 69 | - | - | - | |||||||||||||
| Total | $ | 151,495 | $ | 77,274 | $ | 17,942 | $ | 54,669 | $ | 1,610 | ||||||||||
Unpaid claims
As of September 30, 2021, we estimated a balance of unpaid claims due to third parties for health care services provided to members, including estimates for incurred but not reported claims, of $75.1 million. Estimates for incurred claims are based on historical enrollment and cost trends while also taking into consideration operational changes. Future and actual results typically differ from estimates. Differences could result from an overall change in medical expenses per members, changes in member mix or simply due to addition of new members.
Term Loan
As of September 30, 2021, our Term Loan and Security Agreement (the “Facility”) provides for funding up to $100 million. The Facility’s maturity date is December 31, 2025. As of September 30, 2021, we had $52.8 million of borrowings outstanding under the Facility, and remaining availability under the Facility was $47.2 million. Interest is payable at 12.0% per annum on a quarterly cycle (in arrears) beginning March 31, 2021. Commencing in March of 2021, we have elected to pay 8.0% with the remaining 4.0% being added to principal as “paid in kind” (“PIK”) for a period of three years (or twelve payments), in lieu of the full 12.0% in cash.
We must meet a borrowing base milestone by demonstrating to the lenders that revenue for any three consecutive month period (ending after the Facility’s closing date, but on or prior to December 31, 2021) is greater than or equal to $125.0 million. Additionally, we must remain in compliance with financial covenants such as minimum liquidity of $5.0 million and annual minimum revenue levels. In addition, the Facility restricts our ability and the ability of our subsidiaries to, among other things, incur indebtedness and liens. The maturity date may be accelerated as a remedy under the certain default provisions in the agreement, or in the event a mandatory prepayment event occurs. For certain days in September 2021, our minimum liquidity, as defined in the Agreement, fell below $5.0 million. We have obtained a waiver of this debt covenant violation from the lender, which occurred on those days.
Unsecured Debt
As of September 30, 2021, we have a $15.0 million unsecured note with a former equity investor. The note carries interest of 10.0% per year. Its principal balance plus accrued interest, is due at maturity, which is the earlier of June 28, 2023 or a change in control transaction. The Transaction pertaining to P3’s merger with Foresight does not constitute a change in control. As of September 30, 2021, accrued interest totaled $5.3 million on this note.
For additional discussion of our unpaid claims, term loan, unsecured debt and operating leases, see Notes 4 (Company Liquidity, Operations and Management’s Plans), 9 (Claims Payable), 10 (Long-term Debt), and 17 (Leases) in our consolidated financial statements as of and for the period ended September 30, 2021 included elsewhere in this Current Report on Form 8-K.
53
Off-Balance Sheet Arrangements
We did not have any off-balance sheet arrangements as of September 30, 2021.
JOBS Act
We qualify as an “emerging growth company” pursuant to the provisions of the JOBS Act. For as long as we are an “emerging growth company,” we may take advantage of certain exemptions from various reporting requirements that are applicable to other public companies that are not “emerging growth companies,” including, but not limited to, not being required to comply with the auditor attestation requirements of Section 404(b) of the Sarbanes-Oxley Act, reduced disclosure obligations regarding executive compensation in our periodic reports and proxy statements, exemptions from the requirements of holding advisory “say-on-pay” votes on executive compensation and shareholder advisory votes on golden parachute compensation.
In addition, under the JOBS Act, emerging growth companies can delay adopting new or revised accounting standards until such time as those standards apply to private companies. We intend to take advantage of the longer phase-in periods for the adoption of new or revised financial accounting standards under the JOBS Act until we are no longer an emerging growth company. Our election to use the phase-in periods permitted by this election may make it difficult to compare our financial statements to those of non-emerging growth companies and other emerging growth companies that have opted out of the longer phase-in periods permitted under the JOBS Act and who will comply with new or revised financial accounting standards. If we were to subsequently elect instead to comply with public company effective dates, such election would be irrevocable pursuant to the JOBS Act.
Critical Accounting Policies and Estimates
The discussion and analysis of our financial condition and results of operations are based upon our consolidated financial statements, which have been prepared in accordance with GAAP. The preparation of these consolidated financial statements requires management use judgment in the application of accounting policies, including making estimates and assumptions that could affect assets and liabilities, revenue and expenses and related disclosures of contingent assets and liabilities at the date of our financial statements. Management bases its estimates on the best information available at the time, its experiences and various other assumptions believed to be reasonable under the circumstances. Actual results could differ from those estimates. For a more detailed discussion of our significant accounting policies, see Note 2 to the P3 consolidated financial statements as of and for the period ended September 30, 2021 included elsewhere in this Current Report on Form 8-K. Below is a discussion of accounting policies that are particularly important to the portrayal of our financial condition and results of operations and require the application of significant judgment by our management.
Capitated Revenue
The transaction price for our capitated payor contracts is variable as it primarily includes PPPM fees associated with unspecified membership. Medicare pays capitation using a “risk adjustment model”, which compensates providers based on the health status (acuity) of each individual patient. MA plans with higher acuity patients receive higher premiums. Conversely, MA plans with lower acuity patients receive lesser premiums. Under the risk adjustment model, capitation is paid on an interim basis based on enrollee data submitted for the preceding year and is adjusted in subsequent periods after final data is compiled. As premiums are adjusted via this risk adjustment model (via a Risk Adjustment Factor, “RAF”), the Company’s PMPM payments will change commensurately with how our contracted MA plans’ premiums change with CMS. In certain contracts, PMPM fees also include adjustments for items such as performance incentives or penalties based on the achievement of certain clinical quality metrics as contracted with payors.
Capitated revenues are recognized based on an estimated PMPM transaction price to transfer the service for a distinct increment of the series (e.g. month) and is recognized net of projected acuity adjustments and performance incentives or penalties as management can reasonably estimate the ultimate PMPM payment of those contracts. The Company recognizes revenue in the month in which eligible members are entitled to receive healthcare benefits during the contract term. The capitation amount is subject to possible retroactive premium risk adjustments based on the member’s individual acuity.
54
Healthcare Services Expense and Claims Payable (collectively, “Medical Expense”)
The cost of healthcare services is recognized in the period services are provided. Medical expense includes costs of all covered services provided to members assigned by the health plans under P3’s at-risk model. Medical expense includes the cost for third-party healthcare service providers, the cost for overseeing the quality of care and programs, and from time to time, remediation of certain claims that might result from periodic reviews conducted by various regulatory agencies. This also includes an estimate of the cost of services that have been incurred, but not yet reported (“IBNR”).
Management estimates the Company’s IBNR by applying standard actuarial methodologies, which utilize historical data, including the period between the date services are rendered and the date claims received (and paid), denied claims activity, expected medical cost inflation, seasonality patterns, and changes in membership mix. Such estimates are subject to impact from changes in both the regulatory and economic environments. The Company’s claims payable represents management’s best estimate of its liability for unpaid medical costs. We have included incurred but not reported claims of approximately $56.9 million and $75.1 million on our balance sheet as of December 31, 2020 and September 30, 2021, respectively.
Premium Deficiency Reserves
ASC 944-60-25-4 requires a premium deficiency reserve (“PDR”) when there is a probable future loss on unearned capitated premiums after estimated expected claim costs and claim adjustment expenses. A PDR is recognized when the unearned premium reserve is insufficient to cover the existing books of business and represents an advance recognition of a probable future loss in the current period. If a PDR exists, the amount shall be recognized by recording an additional liability for the probable future deficiency on the current period’s consolidated balance sheet with a corresponding non-cash charge to the consolidated statement of operations. In P3’s at-risk arrangements, the more we improve health outcomes and lower the overall cost of care, the more profitable we will be over time. When we enter new arrangements, our first-year operations typically result in a loss. As our members mature, we have observed that their profitability increases over time.
We assess the profitability of our at-risk arrangements to identify contracts where current operating results or forecasts indicate probable future losses. Management estimates the Company’s PDR by utilizing estimates of membership growth rates, changes in membership mix, estimated PMPM payments under contracts, historical claims data, seasonality patterns, our ability to lower the overall cost of care and incremental medical costs, such as those related to COVID-19 admissions. Such estimates are subject to impact from changes in both the regulatory and economic environments. The Company’s PDR represents management’s best estimate of its probable future losses. We have included premium deficiency reserve liabilities of approximately $0 and $4.6 million on our accompanying consolidated balance sheet as of December 31, 2020 and September 30, 2021, respectively.
Unit-based Compensation
ASC 718, Compensation—Stock Compensation (“ASC 718”) requires the measurement of the cost of the employee services received in exchange for an award of equity instruments based on the grant-date fair value or, in certain circumstances, the calculated value of the award. Under P3’s unit-based incentive plan, the Company may reward grantees with various types of awards, including but not limited to profits interests on a service-based or performance-based schedule. These awards may also contain market conditions.
For performance-vesting units, P3 recognizes unit-based compensation expense when it is probable that the underlying performance condition will be achieved. The Company will analyze if a performance condition is probable for each reporting period through the settlement date for awards subject to performance vesting. For service-vesting units, P3 recognizes unit-based compensation expense over the requisite service period for each separately vesting portion of the profits interest as if the award was, in substance, multiple awards.
Recent Accounting Pronouncements
For the impact of new accounting standards, see Note 3 to our consolidated financial statements as of and for the period ended September 30, 2021 included elsewhere in this Current Report on Form 8-K.
55
Quantitative and Qualitative Disclosures about Market Risk
Market risk represents the risk of loss that may impact our financial position due to adverse changes in financial market prices and rates. Our market risk exposure is primarily a result of exposure due to potential changes in inflation or interest rates. We do not hold financial instruments for trading purposes.
Interest Rate Risk
Borrowing under the Facility bear fixed interest at 12.0% per annum on a quarterly cycle (in arrears). Commencing in March of 2021, we have elected to pay 8.0% with the remaining 4.0% being added to principal as “paid in kind” (“PIK”) for a period of three years (or twelve payments), in lieu of the full 12.0% in cash.
We had cash of $4.3 million and restricted cash of $0.3 million, as of September 30, 2021, consisting primarily of bank deposits, certificates of deposits and money market funds. Such interest-earning instruments carry a degree of interest rate risk. The goals of our investment policy are liquidity and capital preservation. We believe that we do not have any material exposure to changes in the fair value of these assets as a result of changes in interest rates due to the short-term nature of our cash and restricted cash.
Inflation Risk
Based on our analysis of the periods presented, we believe that inflation has not had a material effect on our operating results. There can be no assurance that future inflation will not have an adverse impact on our operating results.
56